Dr. Irena Petric, NOM Marion Appel, Intomart GfK
Prof dr Edith de Leeuw, Utrecht University
Worldwide Readership Research Symposium Valencia 2009 Session 6.4
Introduction
Using on-line interviewing in access panels for media research has been a reality for the Dutch national readership survey since 2002. The quantity aspect is evident. The quality of such an approach needs to be assured by measures taken to overcome its drawbacks. The innovative and yet traditional survey design taken for NPM is a good example of how quantity and quality can meet media research standards.
On-line interviewing for media research is not without danger. Since the internet is itself a medium, the users of the internet are almost certainly biased. Samples drawn from on-line sources can hardly be expected to provide a representative sample of the population.
Still, for years NPM uses on-line access panels for – a part of – its fieldwork. The reason why is obvious: the costs of an on-line interview are far below those of a face-to-face interview, involving travelling and personal visits by an interviewer.
On-line panels certainly have advantages, but there are also threats to the quality of the resulting data.
A mixed mode approach, in which data can be used complementary, combines the best of both worlds: the cost-effectiveness of on-line panels and the quality of random probability sampling.
In 2006, NOM redesigned the Dutch national readership survey NPM to build in guarantees for a more representative sampling and weighting, using a two-step approach (Petric & Appel, 2007). In the first step, the foundation of the survey is built on a random probability sample of homes, which is then used in the second phase as an enumeration survey for the sampling and weighting of the on-line sample.
This combined approach is unique in its efforts to enhance overall quality of an economically viable study. Where currently research clients are faced with increasing field costs, this is a practical solution for the longer term.
Background
Between 2002 and 2006, NPM was run mostly in an on-line access panel and met an increasing number of problems concerning the representativity of the survey as well as the plausibility of the results. At the Symposium of 2007, we presented the new approach for the first time (Petric & Appel, 2007).
In 2006, at the same time as re-designing the readership method, a new approach to sampling was developed. Following the example of more traditionally panel-based surveys like a TV panel, where it is good practice to run an extensive establishment or enumeration survey, it was decided to expand further on this. As the foundation of the NPM-survey, a full random probability sample from the Dutch population is interviewed, taking all possible efforts to achieve a high response rate.
Using the random sample’s results, the stratification of the gross on-line sample as well as the weighting input is calculated. The weighted sample of face-to-face and on-line samples combined is then used for the readership reporting.
Based on this approach, NOM published the readership currency twice a year, from October 2007. The changes were well received by the market and the new NPM-approach is accepted as a state-of-the-art solution for good fieldwork. The national readership survey in the Netherlands does indeed meet the high standards that media research should comply with.
Theoretical background of the representativeness of on-line access panel samples
-
- Concept of on-line interviewing
In this paper we distinguish the concept of on-line interviewing into two different meanings. Firstly, on-line interviewing refers to the mode of completing a questionnaire, i.e. by completing an electronic questionnaire by way of an internet connection on the individual’s computer. Normally, a link is provided by the research agency.
Secondly, on-line interviewing is also used to refer to on-line survey samples, usually on-line access pool or panel, since these panellists will indeed always access the questionnaire on-line.
We want to point out that both concepts of on-line interviewing are easily mixed-up, so we propose to use the following definitions:
-
-
- On-line interviewing refers to the mode of completion of a questionnaire and can be applied to both respondents that are drawn from random samples or from access panels
- On-line access panel refers to the use of an on-line access panel as a sample frame for on-line interviews.
-
In this paper we shall mainly focus on the second concept, the use of on-line panels in media research.
Response calculation in an on-line access panel
On-line panel members are recruited in many different ways. Primarily, on-line panels for research purposes have an underlying random sample source. Research institutes re-contact respondents from surveys that were based on random probability samples and invite them to take part in their on-line access panel. Although this principle is underlying the access panel, it is often very difficult to calculate a fair response rate to any survey they take part in as panel members. In the first place response is in this case composed of different layers: one should take into account the response rate to the originating survey, then to the recruitment of the panel, then to the survey in question. This might well lead to low percentages e.g:
60% response to the initial survey * 40% response to the recruitment (double opt-in) * 70% to the access panel interview leads to 17% response. This type of response calculation, let’s refer to this as composite response (CR) is hardly ever reported because the panel situation is more complex: additional sources may have been used to recruit specific segments; panel management will decide on keeping people in the panel or not, etc.
Another factor complicating the reporting of CR is the sampling method used in access panel research. In many cases quota sampling is used or a further filtering based on screening interviews may have taken place which may have led to response drop- off. These approaches make it fairly impossible to report any type of response rate.
An important factor in the evaluation of response within access panels is the differences between segments. In our experience younger people are more difficult to recruit, as well as more difficult to retain on the panel than older people. The segment of people above 55 are very faithful, will remain on the panel longer and respond extremely well to invitations to complete a questionnaire. This is obviously a pattern that follows from their specific life style, which induced them to be active on the internet in the first place and take part in an access panel as well. These facts make it necessary to draw an AP-sample stratified by age.
Finally we would like to consider the role of frequency of internet usage. Certainly, a panelist who is quite active on the internet for whatever reason is more likely to open his panel invitation sooner than a less frequent user. We stress the fact that stratifying the survey sample by frequency of internet usage may be an important quality aspect of your sample, at the same time the effect of this strategy is minimized when the survey opens just for a few hours or even days. In this way, the less active people will never be in time. The consequences for the quality of the sample are obvious.
In many researchers’ experience the effects are less prominent than might be expected. For many research topics the differences between different segments and life styles may be less relevant. Media research will need to take these observations into account if they want to conduct a survey that treats all publications fair and equal.
Role of panel management of an access panel
Panel management is an important instrument to ensure the quality of the access panel interviews. A major responsibility of the research institute is the exclusion of fraudulent or deceptive panellists. Becoming a member of an access panel can be incentive driven and therefore promotes certain groups to become a professional panellist. There is evidence that this effect is larger in on- line access panels than in other panel based research. Van Meurs (van Meurs, Ossenbruggen, Nekkers, 2007) showed that only a minor part of access panellists are in fact obviously fraudulent. Their finding pointed at another essential responsibility of researchers, which is to guard the quality of the questionnaires. If a questionnaire is uninteresting, full of matrix questions with less obvious relevance for the individual, anyone might be induced to “straight-line” their responses in order to get through quicker.
Apart from tracing fraudulent panellists, a major task of panel management is to find out if an individual panellist is still “alive”. By regularly updating the database, responses to a invitation to participate in a survey become more predictable and the response rate is high.
There is a flipside to the coin. If in many cases the period for responding to a survey request is too short, an individual panellist may appear to be less active, while in fact he or she is less active on the internet. This is then a segment that might be excluded structurally, as an unwanted result of good panel management.
Mixed-mode strategy and its advantages
The basic assumptions for the collection of valid data can be summarized in the four cornerstones of data quality: good coverage of the intended population, powerful probability sampling, low non-response error, and accurate measurements (Groves, 1989; Biemer & Lyberg, 2003). Groves (1989) also added cost efficiency to the desiderata of good surveys. One of the main advantages of on-line interviewing is its low cost per completed interview. Internet as data collection medium offers more advantages, such as the potential of using complex questionnaires and visual and auditory stimuli, and the quick turn-around time (e.g., De Leeuw, 2008). Furthermore, being a self-administered form of data collection, on-line surveys are less intrusive and more private than interviews; there is an absence of interviewer effects, less need for social desirable answers, and the respondent is in control of the pace.
As all self-administered questionnaires, on-line surveys have been found again and again to lead to less social desirability and more openness in answering sensitive questions when compared with interview surveys (Bronner & Kuilen, 2007; Heerwegh, Billiet & Loosveldt, 2005; Link & Mokdad, 2005; Van Ewijk, 2004). Krauter, Presser & Tourangeau (2008), who had access to hard validating data in the form of college records also found a higher accuracy in web surveys, and report that web surveys increased both the level of reporting sensitive information and the accuracy compared to CATI.
While acknowledging the immense potential of on-line surveys, Couper (2000) pointed out that non-response error and coverage error and are the biggest threats to inference from on-line surveys. However, on-line panels, when managed well, may receive high response rates. For instance, Willems, Van Ossenbruggen & Vonk (2006) in their extensive study of Dutch commercial on-line panels, report that the response varied between 18% and 77% with an average response of 51% ; good panel management influenced the response rate positively. Although response rates over 70% can be reached in an on-line panel, one should take into account that these data are panel data (see also section 2).
Apart from non response, under-coverage of certain important groups is a threat to data quality. Although internet penetration is growing, we get a very diverse picture when we look at it internationally (Blyth 2008), ranging from 84 % in the Netherlands and 81% in Sweden to 55% in the UK and 6% in Turkey. The differences in coverage across countries are so large that Blyth (2008) argues that in order to provide cost-effective international measurements we must embrace a mixed-mode strategy. But even in countries with a high internet penetration, there may be a substantial risk for coverage bias because on-line access varies widely across demographic groups, and a mixed-mode strategy may be called for. For instance, in the Netherlands -a country with coverage of over 80%- internet access is unevenly distributed over the population with more highly educated, younger and native Dutch people having internet access (Bethlehem, 2009). Similar results of a digital divide have been found for other countries (e.g., Couper, Kapteyn, Schonlau, & Winter, 2007; Rookey, Hanway & Dillman, 2008).
When the topic of the study is both related to the medium of data collection and to important characteristics of under-covered sections of the population (e.g., age, and education), the risk of biased estimates is considerable. Readership is such a topic; on- line respondents are not only higher educated and therefore may have a different readership behaviour, they also are on-line and as a consequence will use on-line sources, which will then be over-represented. By using a mixed-mode strategy and collect data from a fresh reference sample one can correct for this. This reference survey should be based on a probability sample of the total population and therefore also include elderly, lower educated, and respondents who are not on-line or are low frequency internet users; for an example of the use of a reference survey see Duffy et al, 2005. The data from this reference survey can then be used in both post stratification strategies and in propensity score adjustment.
Two-step sampling approach for the NPM survey
-
- NPM design
The NPM fieldwork design is aimed at taking advantage of both methods: avoiding high costs as well optimizing the participation of all segments of the Dutch population in the survey, whether young males, older females or ethnic groups, by offering them to choose the completion method that fits them best. Within the random probability sample, this approach is used to maximize response.
In addition an on-line access panel sample is used to increase the sample size as well as enhance the sample structure.
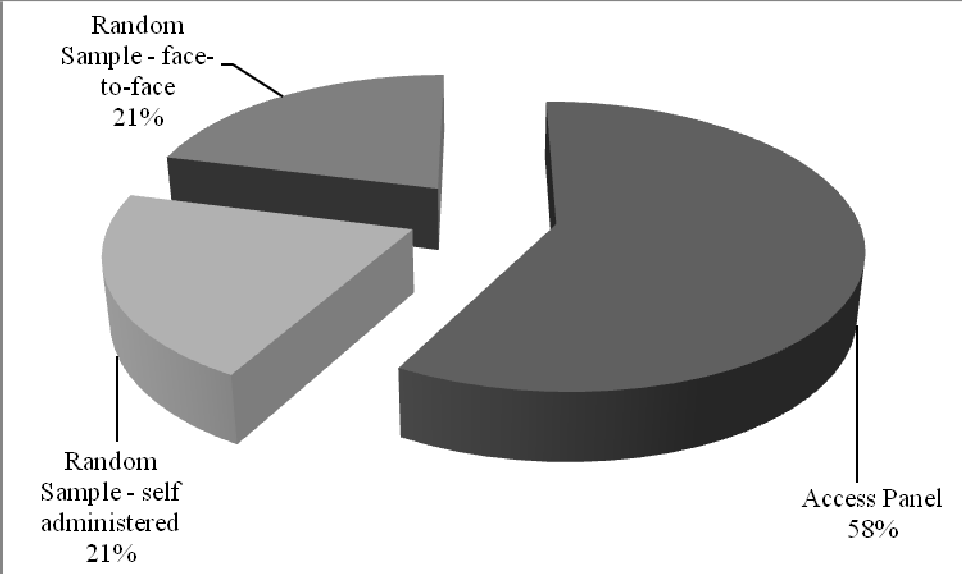
Figure 1
Composition of NPM sample (2008-II/2009-I) by source and completion method

Sampling and fieldwork
For NPM, respondents are recruited from two sampling sources: a) the Dutch Postal Addresses File, containing all addresses in the Netherlands to which mail is delivered (in effect, all private homes) and b) the Intomart GfK on-line access panel of app.
125.000 people. Each sample is treated separately, achieving maximum response rates. After completion of the fieldwork waves, both sources are then combined in a two-step weighting procedure.
The recruitment procedure followed in either sample ensures optimal comparability and the highest achievable response rates. Both samples make use of the same on-line questionnaire. These measures ensure the underlying quality of both fieldwork operations and avoid biases that might oppose the combination of both samples into one reporting database.
Random sample fieldwork approach
Randomly selected addresses from the national postal database are approached by introductory letter. In this letter people are asked to cooperate in a survey when the interviewer shall visit them, but also, a login name and password are provided, should respondents choose to fill in the questionnaire themselves on-line. Interviewers then visit the invited addresses and try to conduct the interview directly or leave behind a note, explaining that they will visit them again and inviting people to respond via internet. If people refuse to cooperate, interviewers offer them again the option to fill in the questionnaire on-line at their chosen time. If people accept, the random respondent selection is performed and the interview conducted. In principle, for the face-to-face interviews, the interviewer is instructed to hand over the laptop once it is logged into the questionnaire for the respondent to complete it un-aided. However, a large proportion of the face-to-face respondents prefer to be assisted by the interviewer in handling the laptop.
The objective of allowing people in a random probability sample to respond on-line is obviously to increase the response rate: people are free to choose their own time to fill in the questionnaire. The freedom to complete the questionnaire when and how they prefer, has proved to be successful. We have achieved a response rate of 42% over the past few years where response rates have been declining steadily. Taking into account the length of the questionnaire, we are quite satisfied. Also, as a result of this approach the sample composition is more balanced.
On-line access panel
In addition to the random sample, a weekly sample from the on-line access panel is invited by e-mail. The sample is balanced by level of education, age, gender and frequency of internet usage. The sampling target is derived from the sample structure of the random sample for the internet population. The respondents are asked to fill in the NPM questionnaire, achieving a steady response level of 69%. For these interviews, again, exactly the same questionnaire is used as the one in the corresponding field sample at that moment.
The data from both fieldwork methods are then added together into one file and weighted according to population norms, including the internet usage characteristics derived from the NPM random sample. As a result the complete database is reported and projected to the Dutch population of 13 years +.
Weighting results
The database from the random probability sample is weighted against Dutch population (Gold Standard population data based on the Dutch Central Bureau for Statistics). A very detailed weighting scheme is used both regional and socio- demographic. This sample of 10.400 achieves an effectiveness of 73% and a maximum weight range between 0,2 and 5.
The resulting database is then used to establish the weighting scheme of the total sample. Especially the population characteristics by internet usage are not given in any statistic source, so these are derived from the weighted random sample for NPM itselfi.
The combined total NPM sample of 24.960 achieves an effectiveness of 74% and a maximum weight range between 0,1 and 5.
Analysis of the NPM sample structure
-
- Comparison of Random Probability sample vs Total Sample structure
Taking into account the response optimisation of the random sample, we expected to have a fairly balanced sample to start with. One observation is needed: the address based sample frame, combined with the decision to interview one person per household, implies that a re-weighting is necessary to achieve a person-based sample. Apart from this, we indeed find only relatively low weights, even for notoriously difficult segments.
The figures below show the difference in sample structure within the Random Sample (RS), compared to the Total Sample, the combined sample of 24.960 (TS).
Figure 2
Age profile of Random Sample and Total Sample, unweighted;

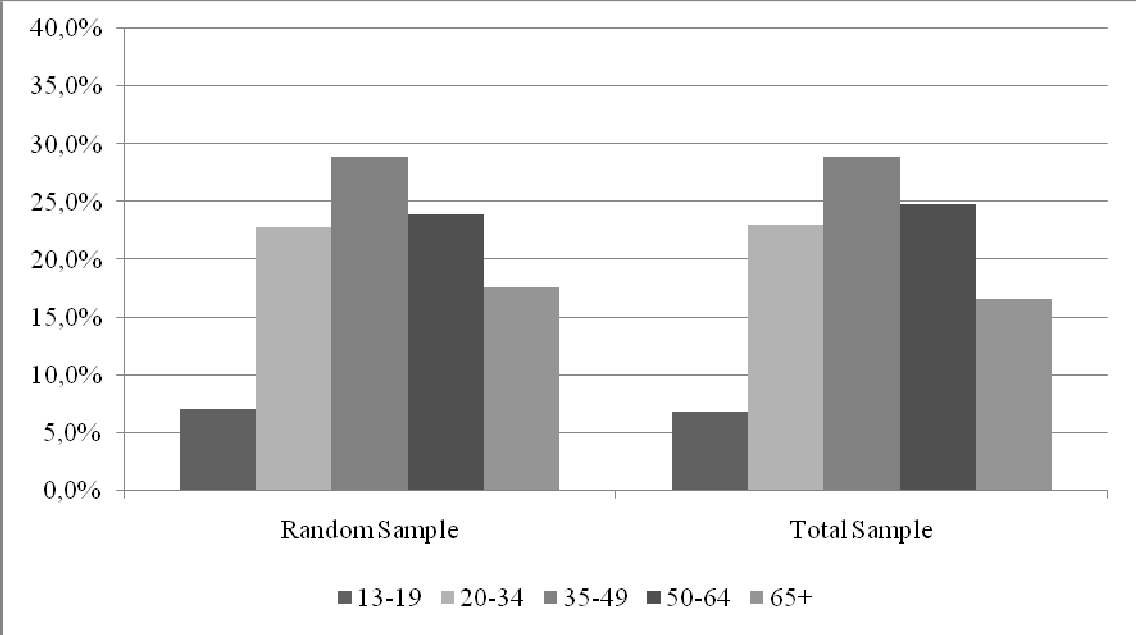
Figure 3
Sexe x age profile Random Sample and Total Sample, unweighted

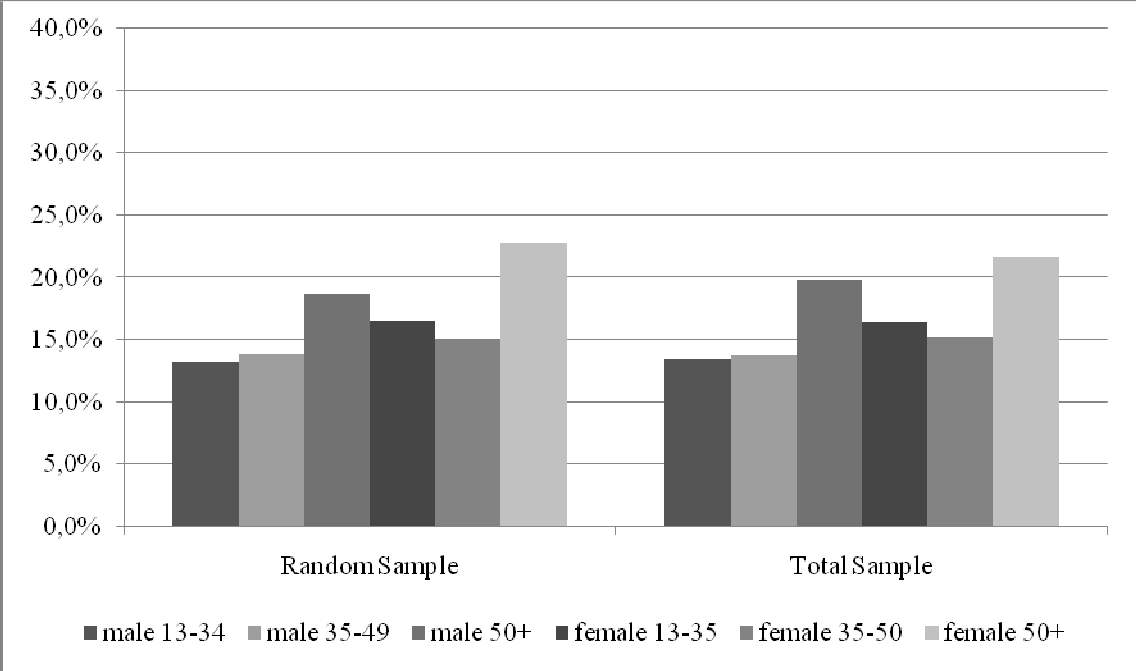
Figure 4
Education profile Random Sample and Total Sample, unweighted

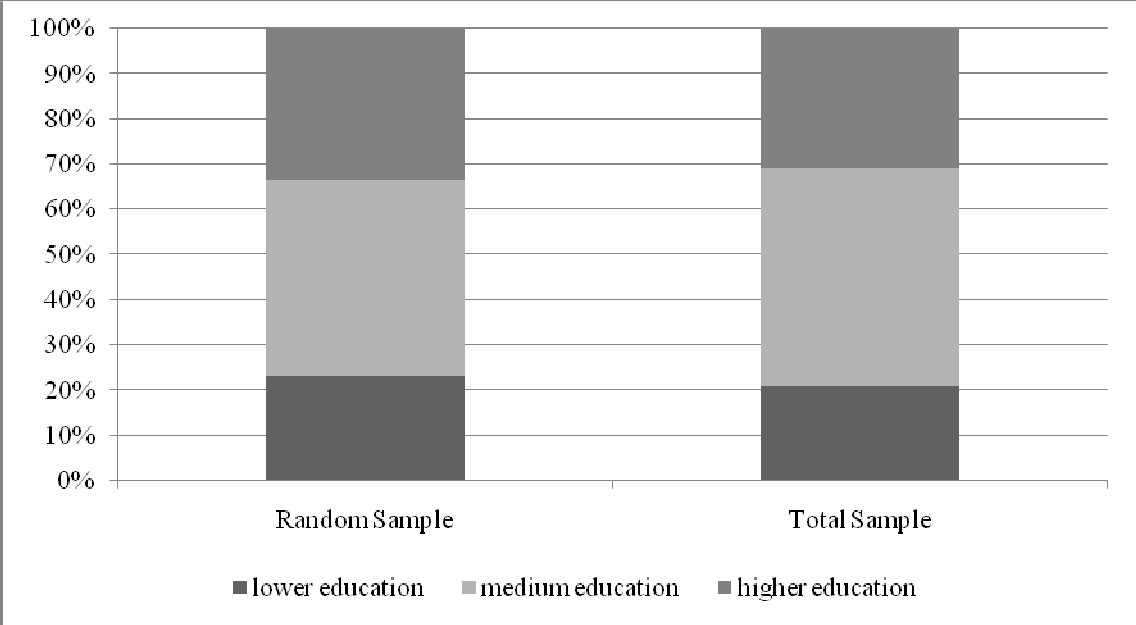
The profiles of the samples differ on the major socio demographic variables. This difference would have been much bigger if we would not have offered the “self-completion”-option via the internet to the random sample. Previous studies have shown that this portion of the sample (17%) contains the younger males that would otherwise not have participated at all.
Comparison of Random Probability sample vs Total Sample media results
The question then remains how much difference is found between readership results from the combined samples (TS), compared to the Random sample (RS). To analyse these differences we have weighted both samples according to the weighting scheme discussed above. That is to say, the RS is weighted as usual against Gold Standard population figures. Then the total sample is weighted against the population structure as derived from the RS, split by the internet-population and the non-internet users.
The figures below show the media usage profiles of the two weighted samples and focus on the major readership results.
Figure 5
Media usage profile of Random Sample and Total Sample (weighted)

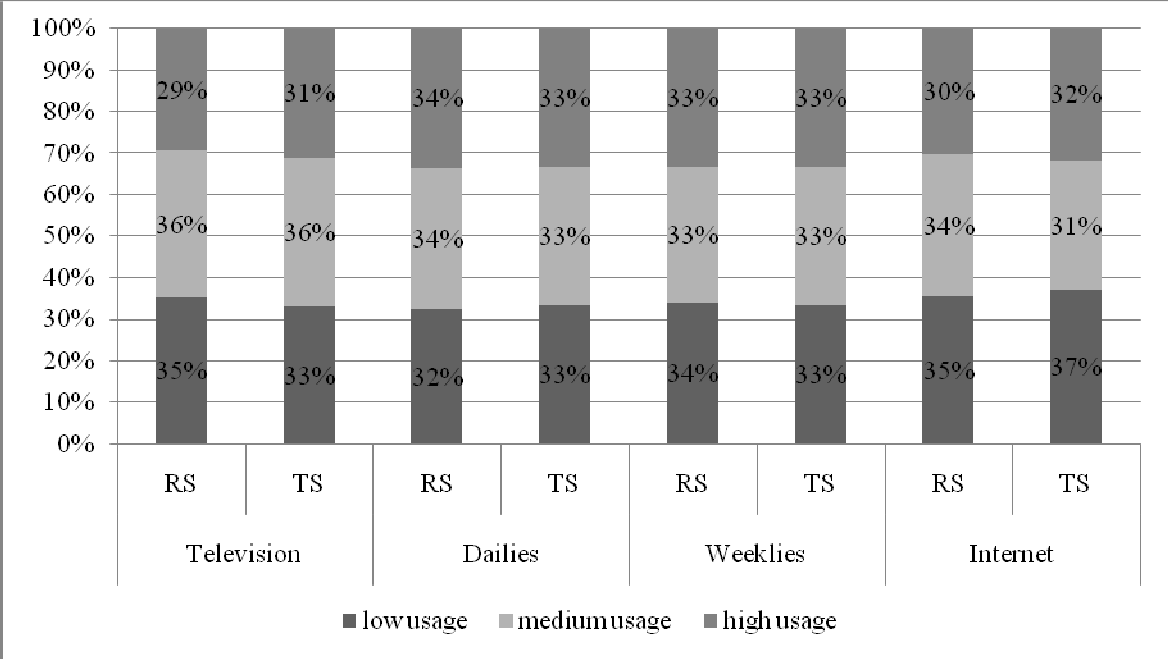
Figure 6
Gross average readership Weekly magazines, Monthly magazines and Daily newspapers, Random Sample and Total Sample (weighted)

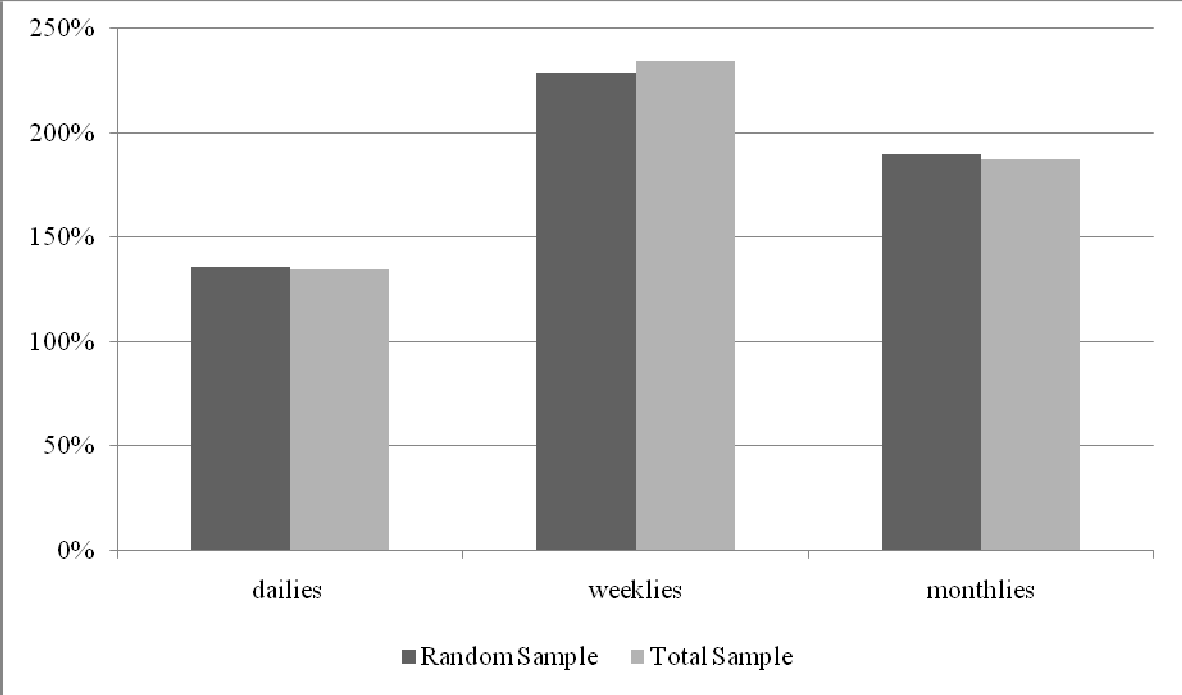
Figure 7.
Gross average readership by magazine type, Random Sample and Total Sample (weighted)

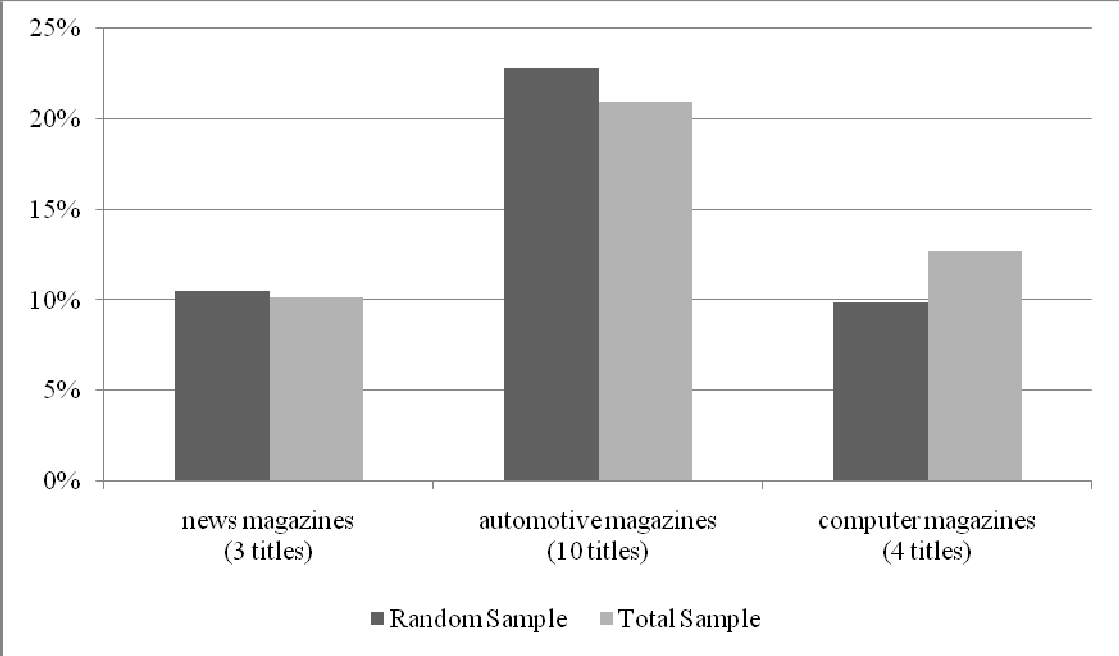
Figure 8.
Gross average readership by magazine type, Random Sample and Total Sample (weighted)
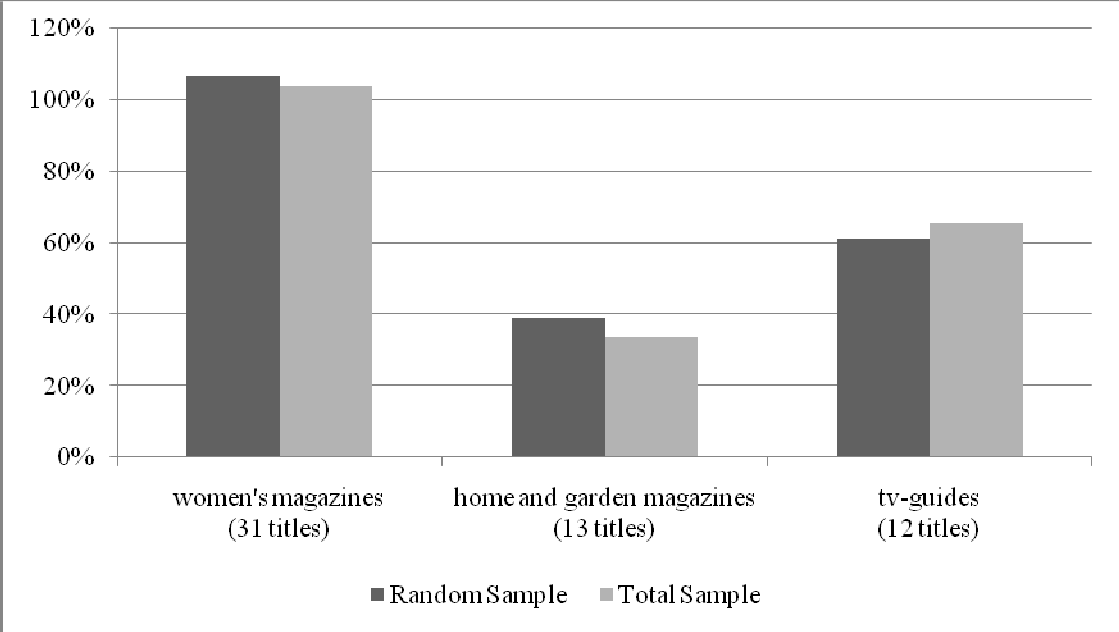
5.2 Conclusion media usage
As anticipated, we find very few differences between the media behaviour as measured in the Random Sample compared to the Total Sample as published for media planning. Even critical magazines that normally show big differences based on profiles of internet users compared to the average population, like automotive magazines, remain within acceptable margins. Computer magazines are the exception to the rule. This is the ultimate proof that a good solution for mixed mode media measurement is possible.
- Conclusions concerning the value of this approach for the measurement of media
The NPM operation is in our view a unique application of modern technique and insights in order to achieve an economically as well as methodologically acceptable national readership survey.
The sampling and fieldwork approach optimize both response rates over-all and in sub groups, both in the random probability sample and the access panel sample. All possible measures are taken to be able to combine the two samples into one database from which the published readership is derived. However: its foundation is the random sample, as many researchers are convinced it should be.
We have analysed the structure of the samples and the effectiveness of the weighting, thereby proving that the approach is indeed successful in the objectives for media research surveys:
- Random sampling for equal probability
- Maximum response rate
- No structural under-coverage of relevant segments
- Minimised interviewer bias
- Identical questionnaires
Our findings have also proved that the two samples, random versus access panel are not 100% compatible. The underlying reasons for this difference are most likely found in psychological and sociological differences between the two sources. We do however conclude that these differences are very small and have no effect on the overall quality of the survey. Using the random sample as a control for the full survey improves the reliability and validity of the NPM survey. Using the on-line access panel as an economic solution for increasing samples has in fact increased the perceived value of the NPM survey results.
References
Bethlehem, J. (2009). Applied survey methods: As statistical perspective. New York: Wiley. Biemer, Paul P., & Lyberg, Lars E. (2003). Introduction to survey quality. New York: Wiley.
Blyth, Bill (2008). Mixed-mode: the only ‘fitness’ regime? International Journal of Market Research, 50, 2, 241-266
Bronner, Fred & Kuijlen, Ton (2007). The live or digital interviewer. A comparison between CASI, CAPI, and CATI with respect to differences in response behaviour. International Journal of Market Research, 49, 2, 167-190.
Couper, Mick P. (2000). Web surveys: A review of issues and approaches. Public Opinion Quarterly, 64, 464-494.
Couper, Mick P., Kapteyn, Arie, Schonlau, Matthias & Winter, J. (2007). Noncoverage and nonresponse in an Internet survey. Social Science Research, 36, 1, 131-148.
De Leeuw, Edith D. (2005). To mix or not to mix data collection modes in surveys. Journal of Official Statistics, 21, 233–255.
De Leeuw, Edith. D. (2008). Choosing the method of data collection. In Edith D. de Leeuw, Joop J. Hox & Don A. Dillman. (Eds) International Handbook of Survey Methodology. New York: Psychology Press (former Lawrence Erlbaum), 113-135.
Duffy, B., Smith, K., Terhanian, G., & Brenner, J. (2005). Comparing data from on-line and face-to-face surveys. International Journal of Market Research, 47, 615-639.
Groves, Robert, M. (1989). Survey error and survey cost. New York: Wiley.
Heerwegh, Dirk, Billiet, Jaak, & Loosveldt, Geert (2005). Opinies op bestelling? Een experimenteel onderzoek naar het effect van vraagverwoording en sociale wenselijkheid op de proprtie voor en tegenstanders van gemeentelijk migrantenstemrecht [In Dutch: Opinions on Demand? An experimental investigation of the effect of question wording and social desirability on the proportion of proponents and opponents of municipal suffrage for immigrants] Tijdschrift voor Sociologie, 2005, 26, 3, 189-208.
Krauter, Frauke, Presser, Stanley, & Tourangeau, Roger (2008). Social desirability bias in CATI, IVR, and Web Surveys. The effect of Mode and Question Sensitivity. Public Opinion Quarterly, 2008, 72, 5, 847-865.
Link, Michael, W., & Mokdad, Ali H (2005). Effects of survey mode on self-reports of adult alcohol consumption: A comparison of mail, web and telephone approaches. Journal of Studies on Alcohol, March 2005, pp239-245.
Petric, Irena and Appel, Marion (2007): The Readership Currency: Dutch Design, How a new methodology for AIR measurement opens up new perspectives for the print advertisers and publishers, Worldwide Readership Research Symposium. Vienna
Rookey, Bryan, D., Hanway, S., & Dillman, D.A. (2008) Does a probability-based household panel benefit from assignment to postal response as an alternative to internet-only? Public Opinion Quarterly, 72, 5, 962-984.
Van Ewijk, Reyn (2004). Onderzoek via telefoon en Internet: De verschillen. [In Dutch: Surveys by means of telephone and Internet: The differences]. Clou, 14, 38-40.
Van Meurs, Lex, Van Ossenbruggen, Robert and Nekkers, Liesbeth (2007). Do rotten apples spoil the whole barrel? Esomar conference on Panel Research. Orlando.
Willems, Pieter, Van Ossenbruggen, Robert, & Vonk, Ted (2006). The effect of panel recruitment and management on research results: A study across 19 on-line panels. Proceedings of the ESOMAR World research Conference, Panel Research 2006, 317, 79-99. Amsterdam: ESOMAR.
i In future the source for this weighting may be derived from the newly set-up Media Standard Survey that has been initiated by the 4 combined JIC’s in the Netherlands (SKO, NOM, STIR and RAB).