Liz McMahon and Rebecca Stamp, Kantar Media
Worldwide Readership Research Symposium Valencia 2009 Session 6.5
Introduction
In the world of commercial market research, online data collection has grown rapidly in the last decade to become the preferred option in many markets. However, for good reason, print audience measurement has been slower to follow. Few markets have moved their readership studies wholly online. However, the widespread acceptance of online as a viable data collection tool and the growing pressure on response rates mean that it is increasingly under consideration for full or partial adoption on many readership studies worldwide.
Much published work focuses on sample design, the use of panels and potential bias. However, relatively little has looked at effective web questionnaire design and respondent engagement within the context of readership measurement.
This paper will explore the core principles of best practice online questionnaire design within a highly evolved and advanced digital world. We will make suggestions as to how these principles might be adopted in both custom and audience measurement research. Finally, we identify and consider the particular challenges in marrying the digital evolution with the need for robust and nationally representative readership studies.
The changing context for readership research
While there were initial natural reservations towards online as a primary data collection tool for much media research, the challenges facing researchers and the growth of digital penetration have led to a growing consideration and acceptance of online. In many markets online homes are now in the majority and faster broadband access has also grown rapidly. According to TGI Net1, 72.8% of British adults have access to the Internet at home and 66% of adults have broadband access at home. The equivalent home broadband penetration figures are a little lower in France and Germany but still are estimated at more than 50% of the adult population. At the same time, the industry has faced huge challenges in maintaining response rates using traditional methods of face-to-face or telephone research. This has led to a growing consideration of online as the sole or partial form of data collection for readership and proprietary research for publishers.
In the West at least, with the technology and infrastructure available, our expectations and behaviour online are changing. For the vast numbers who feel at home with the Internet, their experiences span a wide array of virtual worlds, user generated content, interactivity and connectedness. For many users spending their lives flitting between Facebook and Twitter, listening to music on sites like Spotify and connecting with like-minded others on an array of community sites, the somewhat staid and one dimensional web survey is at odds with their typical web experience. As an industry, our questionnaires are massively out of kilter with the capabilities of the digital world. New techniques and technologies are required to keep up with the many users who make the Internet their home. Media companies have adapted to the idea that they need to move from one-way publications into a two way conversational relationship with their audiences. It is time for researchers to do the same.
Why does it matter that our questionnaires keep up to date with the digital world?
- Response rates are falling, across all methods, including online. Respondents are increasingly time poor and savvy in terms of choosing to whom and how they give their opinion – if indeed they do. The days in which consumers could be flattered into giving their opinion have moved on. Now there’s a myriad of sites where opinions can be shared and shaped without any recourse to researchers. We need to compete effectively for their time and effort.
- Respondents are increasingly online and participating in ever more sophisticated ways. In the UK, almost all home Internet use is via broadband (94% of home users). The nature of the online experience is changing, most strikingly through the rapid take up of social networking sites such as Facebook or Bebo. Our latest figures (May 09) suggest that one third of British adults have used a social networking site in the last month. This interactive web experience is their frame of reference for how the web should look, feel and how to use it. Online research also competes for time and attention against these highly engaging online experiences.
1 TGI Net Europa, April 2008 – May 2009
- Given the context, not only must we guard against low or skewed levels of participation but also ensure that the responses we collect are accurate and considered. While many respondents will drop out when they become bored, a significant proportion will soldier on but start to rush their responses, paying less attention to the questions and to the answers that they give.
- The scale and speed of digital change means that we need to ensure long term futureproofing of our approaches. Digital is here to stay and permeating our homes fast. In the UK, the Digital Britain initiative pledges that every UK home will be able to get 2Mbps broadband by 2012. The under 25s in particular have been brought up in a truly digital world. It is vital that we include them effectively in our audience measurement and insight so we can ensure we are planning for the needs of the emerging core readers and consumers.
Clearly then it is worthwhile for us all to consider how we might improve on the online questionnaire experience. But given its importance why haven’t we given it the level of consideration needed to date?
While media companies compete directly for the attention and loyalty of their online users, the focus of research companies has been on the deliverables to our clients. Our energies have been expended in delivering insight and accurate measurement over and above enhancing the respondent experience. However, we are increasingly recognising that respondent engagement is a core part of that delivery.
In readership and media research it is vital that we represent all parts of the population. In doing so we need to ensure a level playing field for all potential participants to ensure that all have an equal opportunity to complete the research both in terms of technical set up and respondent expertise. This can perhaps hinder the creative use of the technologies available.
Finally, a major barrier to innovation and change, is the need to match historic data patterns and, especially pertinent for audience measurement, to ensure comparability across mode. Readership surveys may not move online wholesale in the immediate short term. However, we will increasingly see mixed mode encompassing online (witness both TGI and NRS in the UK) or the hybrid approach of CASI during an in-home interview. Even with an interviewer present the respondent can become fatigued and not give his full attention to the questionnaire.
Engaging self completion questionnaires will always achieve better response rates, lower drop out and higher attention to questions.
The Kantar Experience: Experimentation and Learning
Over the past two years at Kantar, we have embarked on a global initiative to understand what creates engaging survey experiences in a digital world. Our experience covers many different sectors ranging from innovation research for packaged goods through evaluation of public service provision to advertising evaluation and, of course, media research. Our surveys target the general public, businesses, young people and specialist audiences. For our public sector research in particular, the inclusion of all groups of the population regardless of ethnic background, language or disability is vital. Thus we’ve been able to draw on a wide range of experiences and online studies to develop best practice for today’s digital world.
To date the programme of development has covered:
- Sharing learning and opinion across the group worldwide
- Evaluating a global bank of live questionnaires
- Analysing all Kantar surveys fielded across a 3 year (and ongoing) period in order to identify patterns of drop out
- Consulting with web usability and copy writing experts
- A series of usability tests on a range of questionnaires incorporating eye tracking and in depth follow up interviews
- Piloting new question formats, interactive flash tools and techniques, evaluating engagement and data quality.
Within this paper we will share some of this learning and consider how it might be applied to readership questionnaires.
The Principles of Engaging Web Survey Design
Respondent engagement is our ultimate aim but it can be hard to define and is driven by many factors, often interrelated. To aid our thinking we defined engagement as:
ENGAGEMENT = WEB USABILITY + MOTIVATION
Relevance Reward
Effort
Motivation
ENGAGEMENT
Usability Appearance Structure and flow Language
Each constituent part can be important in its own right but there are clearly interrelationships between them. These are all factors that the researcher has a direct influence over in their design and implementation. While they may vary according to circumstance and individual, they will all work together to drive both participation and the level of engagement with the questionnaire:
Low engagement = low participation = unrepresentative findings
Low engagement = bored, inattentive respondents = poor quality, inaccurate findings
How can we utilise the elements of the survey we can control to turn this equation around and produce highly engaged respondents?
Providing Reason to Participate: Motivation
Motivation is critical to respondent engagement. As researchers we spend time setting objectives and writing the questions. Do we really spend enough time thinking about the motivation to take part, other than perhaps the monetary incentive? Online panel providers have invested much effort and thinking into understanding the range of motivations behind participation in order to maintain completion rates and avoid churn. This is just as important for one-off respondent contacts. Without understanding motivation how can we ensure we make the survey experience rewarding and relevant for the respondent? How can we ensure we get quality data from a robust sample of people?
So what are the critical elements driving motivation?
To ensure respondents are motivated, we need to ensure the survey is relevant whilst having a “favourable balance between effort and perceived rewards”, Caroline Jarrett, Effortmark (Kantar Web Usability consultant)
Relevance:
Does the subject matter appear relevant to our audience? This can be challenging for nationally representative samples where there are so many target audiences to consider. To maximise perceived relevance we need to be open with respondents about the reasons for asking the questions and focused in the way in which we ask them. Increasingly relevance can be achieved through:
- Using everyday rather than “researcher” language”
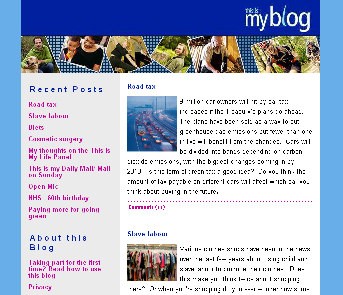
- Using visual mastheads to aid recognition of brands seen around everyday
- Giving the respondent the opportunity to feedback in their own words e.g. on a title that they read
Reward:
We devote our attention to things we consider to be “worthwhile”, we need to gain something from that transaction. For years we have relied on the reluctance of people to say ‘No’, particularly to another human being who is smiling and asking for their help. This worked in tandem with the premise that by giving an opinion to us a respondent would potentially have an influence on a product or ad that makes it better for them. Once we remove the interviewer from the equation we’re left with very little incentive for the respondent to participate.
As we moved online and away from personal interviewing we redefined “worthwhile” around monetary reward.
An over-reliance on financial incentives alone clearly has huge drawbacks. We run the risk of serious cost inflation, whilst limiting ourselves to people for whom a small sum of money is seen as valuable.
We need to seek new ways of making our studies worthwhile. This could be as simple as the entertainment value that it offers or playing up more overtly the way the outputs will be used, or giving people stories that they can tell to their friends. The value equation needs to be redefined with the survey experience at the very heart of it.
Effort:
The final element in our definition of “motivation” is the effort required to complete the survey task. It is partly determined by the nature of the study. However there is a lot that we can do to mitigate the effort required and make survey completion an enjoyable process. Indeed the amount of effort should never outweigh the perceived rewards.
The level of effort is directly linked to web usability factors and the general survey experience:
- The survey is easy to navigate
- The questions are simple and quick to understand and answer
- The survey length is suitable in terms of relevance for the respondent and context of the subject matter
- The survey is engaging throughout – it’s not just about the start and the end
- Minimum pre-amble in introductions and questions
- Help is available where required
Ultimately we need to ensure that the motivation to take part through relevance, reward and effort are realised within the questionnaire experience itself to really maximise participation and quality of data.
Understanding the Survey Landscape: Usability
Every survey happens in the context of the relationship between the questioner and the respondent. The relationship varies over time and question by question. Too much strain on the relationship and the respondent drops out. Fundamental to this relationship is understanding the survey landscape. What elements of questionnaire design do we need to consider in maintaining a positive relationship with our respondents throughout the course of the survey?
No serious media company would consider launching a website without reference to web expertise and best practices. Can all serious research practitioners say the same about their web surveys?
As part of the Kantar initiative we have worked with both web usability experts and copy writers to bring together best practice and an in-house usability testing team for ongoing developments. Every new web questionnaire is designed in line with these guidelines and reviewed by our specialist team.
Appearance
Emotionally and visually pleasing surveys are vital:
-
- If it looks good it’s easier to complete >> Easier to complete surveys mean more accurate answers
- If it looks professional and appealing it will suggest to the respondent that the survey and survey “owner” are trustworthy
>> More trustworthy surveys mean more honest answers Questionnaire Templates:
Best practice online surveys use a design template that complements rather than over shadows the questions themselves. For
some of our custom panels we adapt that template to match the look and feel of the client’s brand and target audience.
The use of space across the screen is an essential part of the overall appearance of the survey. Clearly it is best practice to avoid packing too much onto a page as it immediately looks daunting. Wherever possible we have found that it is better to avoid the need to scroll at all as this limits the effort required of the respondent. While vertical scrolling – up and down the page – is a natural expectation for respondents we found that horizontal scrolling is a rare occurrence on the web and leads to confusion.
Visual Prompts:
One of the pitfalls that many of us fall into is using offline conventions for online research. To maximise engagement we need to tailor surveys to the online environment. What is suitable for a postal questionnaire is unlikely to be the best design for a web questionnaire. Face to face and self completion postal surveys are typically presented via text, however people read and interact online in a very different way. In an online environment people tend to evaluate both the verbal and visual elements of the questionnaire. Appearance and use of images therefore becomes more important.
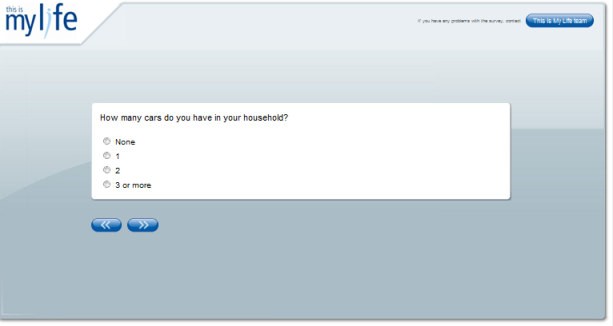
Web users are used to certain visual conventions. For example, buttons are an action, blue and/or underline implies a clickable link, radio buttons are a single choice while checkboxes are multi-choice. Best practice is to make use of these conventions in order to make surveys intuitive. We also need to ensure that we utilise emerging or changing web conventions, learning for example from the web 2.0 world of the likes of Facebook and Twitter. Otherwise we run the risk of being out of sync with respondents understanding of visual short cuts.
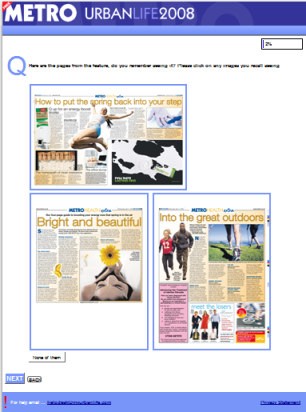
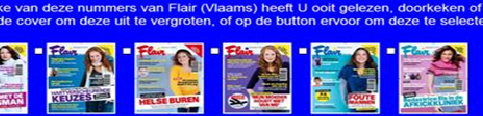
The great advantages for readership research are that we can more easily incorporate colour mastheads, front covers and even pages from within publications to maximise accurate recall while delivering a visually pleasing experience.

Structure and flow
Since 2008, Kantar has systematically reviewed the rate of dropout on all surveys. This has enabled us to ascertain the impact of key elements of survey design:
- Introductions
- Survey length
- Survey flow
- Type of questions
Introductions:
Our drop out analysis revealed that the most dangerous time for loss is the first 5 minutes, where the bulk of drop outs take place. The first few questions set the tone for the survey. Here respondents will judge whether this is a good and interesting use of their time and whether the subject matter is relevant to them. We also found that many of our introductions were not working as hard as they could. They contained long paragraphs of introduction and explanation which together with necessary screening questions were the least engaging part of the questionnaire. We also found that few respondents even read the opening paragraphs, at best scanning the words on the screen.
Total incompletes across the life of a questionnaire
(average across all Kantar projects, 2008)
%
100

Introduction – the greatest rate of loss
80
60
Drop out rate
40
20
0
5 10 15 20 25 30 35
Minutes
As a result we reduced the number of early pages and condensed the relevant information into one easy-to-read section. Recent evidence suggests that this change reduced early incompletes by approximately 5-10%.
Survey Length:
The nature of our complex media world and fragmentation means that our surveys are necessarily becoming longer. Published papers from around the world and our own analysis of drop out, show survey length to be a key determinant of both initial participation to agree and subsequent drop out.
We have found that between 20 and 25 minutes is the critical point at which completion rates deteriorate. In support of these findings, Puleston and Sleep (ESOMAR 2008) recommend a maximum of 60 questions (around 20 minutes) for typical market research studies.
Total incompletes across the life of a questionnaire
(average across all Kantar projects, 2008)
%
100
Beyond 25 minutes incompletes increase
80
60
Drop out rate
40
20
0
5 10 15 20 25 30 35
Minutes
Young people are particularly sensitive to survey length. Below is an example of 12 to 15 year olds with a long questionnaire taking on average some 30 minutes to complete. Drop out begins as early as 10 minutes and then continues to deteriorate.
Total incompletes across the life of a questionnaire
Example: Long questionnaire to 12-15 year olds
%
100
Drop out starts at just 10 minutes and then continues to increase
80
60
Drop out rate
40
20
0
5 10 15 20 25 30 35
Minutes
This is only part of the story. It shows the most extreme reaction to survey completion – the decision not to continue at all. Other participants will continue but with potentially reduced levels of engagement, and therefore lower quality or inaccurate results.
There are measures that we can take to mitigate the risk of drop out or continuation with reduced quality:
- A long questionnaire can be split into 2 or more distinct exercises. This is the route we have chosen for the TGI Online survey, splitting the task into 3. While there are challenges of maintaining interest across all 3 surveys the task becomes more manageable and less daunting than a single study (for details see Impedovo and Greene, WRRS 2007).
- Using a “save and return” function. From our usability interviews we found that respondents voice an interest in being able to save their progress, exit the survey and return at a later point. Clearly there are barriers to this where completion is time sensitive or there may be potential contamination of answers via discussion with others or subsequent exposure to advertising. However it is a natural expectation of many web users based on existing conventions elsewhere and
demonstrates a level of trust in the respondent which we know is a vital ingredient in maintaining a positive relationship through the survey.
-
- Progress indicators. Progress bars and other indicators of progress receive a mixed press. While they can be a useful guide for respondents they are difficult to programme accurately, particularly for heavily versioned or filtered questionnaires and have even been found to increase drop out in some situations. Our conclusions to date suggest that there is little evidence that progress bars (quantitative indicators of progress shown throughout the survey) improve response. However regular, more qualitative indicators of progress (colour coded sections or intermittent displays) have been shown to work positively.
- Use passively collected behavioural data. Do we need to ask questions of respondents or are there less onerous ways in which they can give us (often more accurate) information on behaviour? Increasingly our clients need to understand behaviours and motivation across both online and offline platforms. Rather than asking online behaviour we use cookies or meters to passively record online behaviour while restricting our questioning to offline exposure and to diagnostics.
The ebb and flow of the questionnaire:
The questionnaire needs to establish a relationship with the respondent and to follow the natural flow of a conversation. A successful conversation requires the following elements for both parties to be able to put their point across, enjoy the conversation and come to a natural conclusion:
-
-
- An opener or introduction that clearly sets the objectives and tone
- A willingness from both parties to participate over the required period of time
- An exchange of dialogue in which the participant feels they are able to express their view
- Use of language understood by both parties
- A clear flow of topics and sub topics with relevant connections through to new sections
- Ability to explain if there is a misunderstanding of intended meaning
- A conversation that is relevant to the context of the relationship between initiator and participant and / or to the location in which the conversation takes place
- Ability to maintain the interest of the participant through the course of the conversation with relevant topics and questions
-
The same principles should apply to a questionnaire, particularly self completion where there is no interviewer to bind the questions together with through the conventions of conversation.
Varying the question types and layout (while maintaining consistency between similar questions) helps to maintain interest and concentration. We found it helpful to consider the complexity of the tasks involved. If we ask the respondent to complete a particularly complex or thought provoking task it is helpful to follow this with some simpler questions.
Question types:
Using the drop out analysis and the results from a series of usability tests we were able to identify particular types of question that were most likely to cause drop out or a reduction in engagement. The single biggest culprit is the traditional grid layout. Across an analysis of 3 million survey starts we found that large grid questions accounted for 15% of all incompletes. We also found that repetitive barrages of statements work in much the same way. The repetition, screen layout and work involved are immediately offputting for the respondent.
Here we see an example where a significant number are lost at a barrage of statements included relatively early on in the questionnaire.
Total incompletes across the life of a questionnaire
Large grids
%
100
Barrage of statements causing high incompletes. Respondent interest never recovers
80
60
Drop out rate
40
20
0
5 10 15 20 25 30 35
Minutes
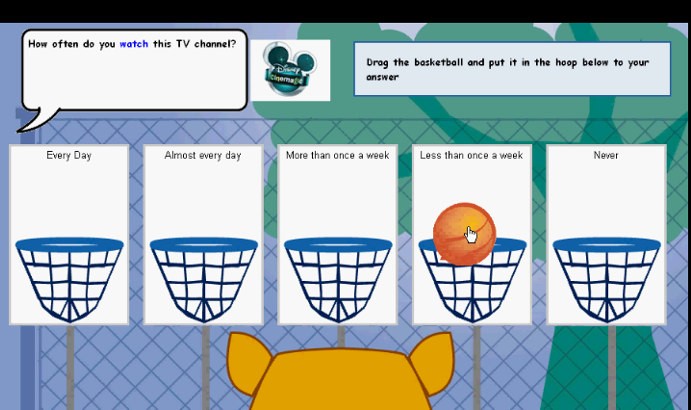
As a result of these findings we have been experimenting with alternatives to grids and image batteries. At minimum, we now try to break them into smaller sections separated by other questions. We have found that alternatives such as “drag and drop” where the respondent selects an image or text and drags it to a coding box are a more engaging task. We talk more about this in a later section.
Language
We have established that the online interview should work as a conversational exchange between researcher and participant. We’ve found that our use of language is absolutely key to both the effort expended by the participant and to the establishment of a successful relationship.
- Ensure it’s an adult to adult conversation. Researchers all too often employ an adult to child tone with patronising explanations and error messages.
- The flow of the questionnaire should build like a conversation – opener, body, closer. It is vital that respondents are engaged at each point. Our evidence shows that respondents are most likely to drop out in the first few questions. They are also likely to speed up at the end and give less considered results. The conversation needs to be two sided all the way through.
- The language and tone of the conversation needs to be simple, but relevant. Our form of words should be friendly, without frills. Importantly, we should be able to hear the respondent’s voice in the answers. Not the researcher.
This is all about giving the respondent the ability to understand and interpret the question and give an answer which reflects their views. The most successful survey of all, in communication terms, is one where the only effort involved for the respondent is in considering their response.
To help us establish best practice principles we turned to professional experts in the field – a team of copywriters. They spent time analysing some example questionnaires and developed a set of principles and training that we can apply to any survey online.
Our key learnings on language are:
- Use everyday language that anyone can understand. Avoid research or marketing jargon. Aim to be colloquial not corporate.
- Cut out all the unnecessary words or phrases in introductions, questions and answers. There’s a temptation to set the scene for every question but we found from eye tracking work that many respondents skim over introductory words, they were serving no useful purpose.
Example:
Replace
“I would like you to think about a number of different issues that may face us in our daily lives. These cover a range of areas including social, economic and environmental issues…”
With:
“How concerned are you about each of the following issues?”
- Don’t increase length by trying to be polite or over explain things
- Avoid big blocks of text – use bullets to improve the reading experience
- No more than 10 words per question. This is a big challenge but we have found that it works in the vast majority of cases.
- Ensure that answer lists can be interpreted independently. In our tests we found that many respondents skip straight down to the answers on the screen with little attention given to the introduction or the question itself. First instincts are to drop straight into the task in hand.
These are interesting findings for readership research where traditionally we have given respondents relatively long introductions in order to set the context and explain the key measurement terms. How do we translate these questions to a screen based environment where respondents are increasingly skipping large blocks of text and focusing on the answers?
Using rich media to enhance online questionnaires
The typical online survey is a simple translation of the familiar “tick box” structure and design created for postal self completion or interviewer administered surveys. Increasingly this is at odds with the sophisticated interactive experience that respondents have with most other activities online. As an industry our questionnaires have become out of synch with the capabilities of the digital world. Media companies have adapted to the idea that they need to move from one-way publications into a two way conversational relationship with their audiences. It is time for researchers to do the same.
The incorporation of rich media into our surveys moves us closer to the experience and expectations of a large number of online users. The most commonly used tool at present is Flash (from Adobe) which has the benefits of being freely available and relatively easy to programme and incorporate into script writing software.
There is already a body of work around the use of rich media and, in particular, Flash questionnaires. Within Kantar we have set up a series of pilots into different question treatments. Across the work published to date there has been consistency in findings that:
- Self claimed engagement is higher with the use of Flash technology. It can result in a more enjoyable experience for the respondent
- Respondents take slightly longer to answer. This is seen to demonstrate that the respondent takes more care and attention when answering
- Although results are found to be broadly similar to non flash surveys, respondents tend to show more variation in their answers e.g. a wider use of points on scales.
Using this form of technology gives the questionnaire designer a richer and wider toolkit to deploy in survey design. We have found that for younger audiences and those who are more technically savvy it can really enhance the survey experience. However it is worth remembering that not all of our respondents are able or willing to engage at the same enhanced level. We need to tailor the survey experience to the audience in hand.
An example here is a questionnaire designed for younger children. The interactivity and positioning of the questions as a game matches their existing online experiences making the survey completion a natural activity.
Metro’s Urban Life study targets a young, urban professional readership who are highly technically adept. As a result we are able to experiment more freely with different types of questioning. We have found the slider scales to be a successful alternative to numerical ratings:
Flash tools are particularly useful when in comes to grid questions. As demonstrated earlier, grids are notorious in terms of causing drop out of online questionnaires. They are a natural means of ascertaining information across large lists of brands (as is common in readership research). However, this runs the risk of respondent fatigue and high drop out rates. The use of rich media to create alternatives such as “drag and drop” or sliding scales at least partially combats the potential fatigue at these key points.
Flash does of course require that respondents have the right computer set up, with the software already available or willing to download it. Broadband is a prerequisite for most interactivity as download times are prohibitively slow with narrowband connections. Based on statistics released by Adobe2 (the parent company) there is a 97-99% penetration for version 9 or above in mature markets. It also depends on the research agency having the design and or interpretation skills to ensure that the most appropriate Flash tools are used to enable the respondent to answer in the way intended.
Finally it is worth highlighting that the use of rich media questions should only be used where it boosts survey engagement. That is it enhances the appearance and aids questionnaire flow, without increasing effort over and above the reward of completion. A survey peppered with rich media and interactivity will slow down the process and the appeal is quickly lost. Indeed, Flash may not be appropriate for all respondent types. Older respondents may not feel at home with drag and drop or sliding scales. Readership surveys may need to have a different format for say the under 35s and the over 65s.
Applying learnings to readership research
Having reviewed and summarised the learnings from our Kantar global initiative, here are our suggestions for developing engaging online readership surveys.
>> Ensure the survey in its self is relevant and rewarding. Don’t rely a reluctance to say no or monetary reward for
motivation:
- Give respondents examples of how the data will be used
- Give them interesting stories to tell about the research they took part in
- Provide open space where respondents can express their own views, in their own terms
2 Study conducted for Adobe by Millward Brown, June 2009. Mature markets include US, Canada, UK, Germany, France, Japan.
>>Ensure effort does not outweigh the intrinsic reward
-
- Ensure questionnaires no longer than 25 minutes or provide options for respondents to complete in several sittings
- Consider length in particular for young respondents.
- Ensure the questionnaire is in consumer rather than researcher language
>>Enlist the help of experts from the web world to challenge survey usability and language
-
- Develop a look and feel for the questionnaire template that is appealing, fresh and engenders trust
- Use the visual conventions of the current and emerging online world
- Utilise Flash to reduce effort and increase enjoyment
- Consider appropriate use or tailored use of flash for different age groups
- Cut words in introductions down to a minimum. Don’t feel we need to explain everything which potentially patronises rather than aids
- Ensure questions are no more than 10 words long. Ensure the codes speak for themselves and allow the respondent to answer on their own terms
- Use visual stimuli such as mastheads
- Review the questionnaires as we would review a conversation. Are all the key elements of the conversation present to empower the participant in taking part.
The challenges for readership research
Many of the learnings from our programme of experimentation have already been put into practice for the custom research that we run for publishers, including readership surveys. However there remain major challenges to our area of the industry in implementing these changes more widely.
One size fits all? How do we engage fully in the digital world, incorporating the techniques and presentation styles of other online media without excluding the less confident or technically enabled respondents? Its vital that we continue to represent all parts of the audience in a equal fashion in order to produce reliable readership estimates. Does this suggest that we cater to the lowest common denominator and exclude the more sophisticated approaches in our questionnaires? Or, do we accept a mixed mode approach, even on a single medium and tailor the questionnaire experience to the individual?
Mixed mode interviewing. It seems likely that in many markets the move to online data collection will be a partial or gradual one for some time to come. This again introduces the challenge of consistency between interviewing medium. Should we replicate the questions administered by an interviewer or paper self completion simply to ensure consistency? Our work to date has shown that online questionnaires are read and completed quite differently to offline versions. We’re deluding ourselves if we believe that consistency exists even if the question wording and format is identical. Do we really want to accept the inevitable drop in quality for the illusion of consistency across online/offline formats?
Futureproofing our surveys. The online experience continues to evolve and change; it’s a dynamic medium. What works or is engaging today may well not be tomorrow. We need to keep on top of the changes and continue to develop our questioning techniques and technology.
Tapping into web based data. Online presents many opportunities that are simply not possible in an offline context. We’re increasingly tapping into web behavioural data alongside survey research. Drawing on real behaviour to track online journeys and readership (through cookie based or meter based techniques) while drawing offline behaviour and diagnostics from recall based surveys presents a real opportunity for readership research. Online communities add extra depth to our understanding. At Kantar Media we’re weaving survey research to our own online communities on many of the panels that we run to get single source quantitative and qualitative understanding.
We’re all working towards an effective solution for online readership research, looking at new ways of engaging with respondents and perhaps for the first time acknowledging that we need to tailor our approaches to the mode and to the individual rather than a blanket approach for all. At the same time publishers are demanding that we link print readership measurement with online readership, particularly for cross media titles. As we move into this new world with new metrics and approaches is it time to take a radical look at our readership measures and develop greater harmonisation across platform?
References:
Inspiring Better Respondent Engagement, Alex Johnson, Tom Ewing, ARF 2009
Measuring the value of respondent engagement – innovative techniques to improve panel quality, Jon Puleston, Deborah Sleep , ESOMAR 2008
Embracing technology in readership surveys, Domenico Impedovo and David Greene, BMRB, Worldwide Readership Research Symposium, 2007
Designing Effective Web Surveys, Mick Couper, 2008
Maximizing respondent engagement: the use of rich media, Jennifer Reid, Monique Morden and Angus Reid, ESOMAR congress 2007
William E. Lipner The Future of Online Market Research, Journal of Advertising Research, June 2007