Judy Vogel and Kelsey Lee-LeGassick, PHD
Bob Shullman and Ted D’Amico, Ipsos Mendelsohn
Worldwide Readership Research Symposium Valencia 2009 Session 1.1
Background & Purpose
Reading behavior is rapidly changing as a result of the Internet and other technological innovations. Today “print” content cannot only be obtained from traditional sources like magazines, newspapers and books, but from many non-traditional sources as well, such as websites, online newsletters, blogs, RSS feeds, e-readers, Facebook, and Twitter.
This study investigated online and “offline” reading behavior, perceptions of online publications and people’s anticipated future online print behavior, especially as it relates to their willingness to pay for online print content. It was hoped that by better understanding these behaviors and perceptions, one could better determine the degree of synergy that exists between printed publications and their online websites, the degree to which possible alternatives to magazines and newspapers are used and evaluated, the demographic differences and similarities between traditional “print” and online readers, and the viability of charging for online print content.
To achieve a better understanding of current and future online print behavior, a questionnaire was designed to provide answers to a number of key questions including:
- How often do people view online magazine and newspaper websites?
- How satisfied are people with online magazine and online newspaper websites?
- How online publications are usually accessed?
- What actions are taken as a result of reading online publications?
- How much time is usually spent reading online publications?
- Are online publications preferred over printed publications?
- What would be done if printed versions were no longer available?
- How willing are people to pay for online publications?
- What is the demographic profile of online publication users?
To provide a frame of reference for interpreting the answers to the questions that were specific to online publications, similar questions (in most instances) were asked of printed publications. In those instances in which this occurred, the results for online and printed publications were compared and contrasted, in total, and by publication type.
Methodology
The in-tab sample consisted of 2,402 adults 18 years of age or older living in the continental United States who completed the entire online study. The sample was drawn from Ipsos’ United States Online Panel, which consists of approximately 440,000 individuals, all of whom are at least 18 years of age. In total, 12,820 e-mail invitations were sent to panelists asking them to participate in the study and, if they did, they would be rewarded with “points” which could be exchanged for a variety of vouchers, gift cards and/or merchandise. To help ensure that the findings were representative of the United States adult population, the in-tab sample of 2,402 adults was weighted to this population using the latest census data. The study was conducted from 22 – 27 July, 2009 and had a response rate of 18.7%.
The questionnaire consisted of two parts. The first part included questions pertaining to Ipsos Mendelsohn’s Barometer Study, a study that is conducted quarterly to determine people’s perceptions of the economy and the government, and their future purchase intentions regarding high-ticket items. The second part of the questionnaire consisted of questions pertinent to the present study, the most important being those that focused on the reading of each of the top 40 consumer publications.
The specific questions and topic areas covered in the second part of the study are shown in the Appendix.
Analytical Approach
For those questions in which respondents were asked about each of 40 publications, the results were analyzed on a publication- by-publication basis. The results were then averaged across the 40 publications, as well as each of ten publication types. The specific publications included in the study and how they were classified with respect to publication type is shown in Exhibit A below. For all analyses, the analytical base was adults. Subsequent analyses will focus on specific sex, age and income segments.
| Exhibit A
Publications Included In Study |
|
| Business | Newspaper |
| BusinessWeek | New York Times |
| Forbes | Washington Post |
| Fortune | USA Today |
| The Economist | |
| Wall Street Journal | Newsweekly |
| Newsweek | |
| Entertainment | Time |
| People | U.S. News & World Report |
| Rolling Stone | |
| TV Guide | Shelter |
| Us Weekly | Better Homes & Gardens |
| Family Circle | |
| General Interest | Good Housekeeping |
| AARP The Magazine | Ladies’ Home Journal |
| Consumer Reports | Martha Stewart Living |
| National Geographic | Southern Living |
| Reader’s Digest | Woman’s Day |
| Gourmet | Sports |
| Cooking Light | ESPN The Magazine |
| Every Day with Rachel Ray | Sports Illustrated |
| Food & Wine | |
| Food Network Magazine | |
| Women’s | |
| Cosmopolitan | |
| Men’s | Glamour |
| Maxim | Lucky |
| Men’s Health | O, The Oprah Magazine |
| Playboy | Vogue |
Before reviewing the findings of the present study, it should be noted that the sample for this study was drawn from an online panel. Consequently, the incidences for any online behaviors or activities that are reported in this paper may be somewhat overstated.
Following are the major findings of the present study. These findings are summarized by four key topic areas:
- Readership behavior and synergy;
- Possible alternatives;
- Reader composition; and
- Viability of charging for online content.
Whenever possible, the results for online publication readership are compared to those for printed publications, in total, and by publication type.
Readership Behavior & Synergy
Incidence of Reading
As can be seen in Figure 1, more than eight-in-ten (82.7%) read or viewed at least one of the 40 publications included in the study in the past six months in either its printed or online version, and more than four-in-ten (42.0%) read or looked into an online version of at least one of the 40 publications within this time frame. As can also be seen in Figure 1, while readers are consuming content both in print and online, reading a publication’s print version doesn’t necessarily translate to readership of its online version. Similarly, reading a publication’s online version doesn’t necessarily translate to readership of the publication’s printed version.
-
- The majority of “online” readers (34.1%) read or looked into both a printed and an online version of at least one of the 40 publications, but not the same publication; and
- A small minority (4.8%) read or looked into online versions exclusively, and even a smaller minority (3.1%) read or looked into both the printed and online versions of the same publication.
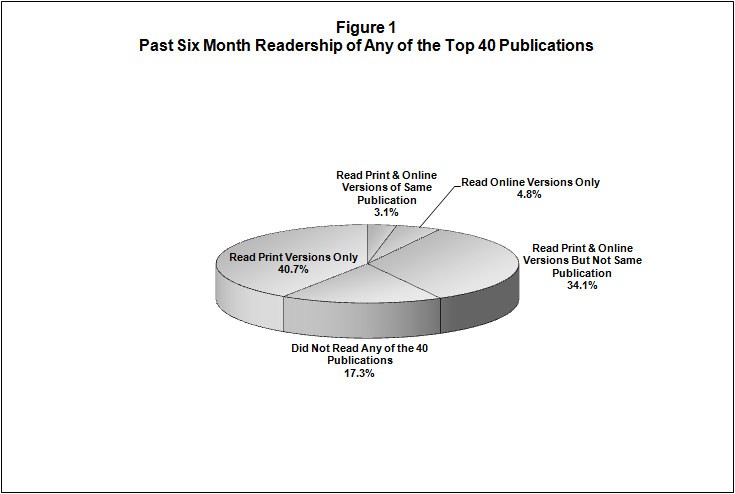
In contrast, more than three-quarters (77.9%) read or looked into a printed version of at least one of the 40 publications in the past six months, 40.7% of whom read or looked into printed versions exclusively.
The above findings strongly suggest that readership isn’t linked to a publication’s brand, but to content. While there’s no real link between the two, print versions of publications are more likely to have exclusive readership. This is probably due to the variety of sources with which online content is available. While print publications are an exclusive medium, online hosts a variety of sub-media types.
Past Six-Month Readership
On average, across the 40 publications included in the study, online readership accounted for a substantial percent of past 6- month readers. Specifically:
-
- 24.0% read the online version exclusively;
- 14.5% read both the printed and online versions of the same publication; and
- 61.5% read the printed version exclusively.
As can be seen in Table 1, an analysis of online readership by publication type revealed that newspaper websites are the most likely type to have been read online during the past six months. Among those who read the newspapers included in the study in the past six months, 51.0%, on average, indicated that they read the online version of the newspaper within this time period. Other publication types for which online readers accounted for at least 40% of total past six-month readers included Business (48.3%), Gourmet (45.6%), Sports (45.3%), and Men’s (40.1%).
| Table 1
Format or Version of Publication Read in Past 6 Months Base=Adults 18+ |
|||||
| Online | Both | Print Total | Online Total | ||
| Average (40 Publications) | 61.5% | 24.0% | 14.5% | 76.0% | 38.5% |
| Newspaper | 49.0% | 35.7% | 15.2% | 64.3% | 51.0% |
| Business | 51.7% | 30.5% | 17.8% | 69.5% | 48.3% |
| Gourmet | 54.4% | 30.0% | 15.6% | 70.0% | 45.6% |
| Sports | 54.7% | 28.6% | 16.7% | 71.4% | 45.3% |
| M en’s | 59.9% | 23.2% | 16.9% | 76.8% | 40.1% |
| Women’s | 63.2% | 22.4% | 14.4% | 77.6% | 36.8% |
| Newsweekly | 63.3% | 23.8% | 12.9% | 76.2% | 36.7% |
| Entertainment | 64.6% | 21.1% | 14.3% | 78.9% | 35.4% |
| General Interest | 71.3% | 18.1% | 10.6% | 81.9% | 28.7% |
| Shelter | 71.4% | 16.1% | 12.5% | 83.9% | 28.6% |
Median Reading Time
With regard to reading time, people spend a little more than half the time viewing a publication’s website as they do reading a printed publication. On average across the 40 publications included in the study, the median reported time spent viewing a publication’s website was 8.9 minutes, while the median reported time spent reading or looking into a printed publication was
-
- minutes.
Frequency of Use
All respondents in the study were asked how often they view a magazine website and how often they view a newspaper website in the past six months, and not just the websites of the top 40 consumer publications. Based on this line of inquiry, the weekly and monthly incidence levels for visiting a magazine website were about half that of the levels for reading a printed copy of a magazine. Specifically, 18.0% indicated that they viewed a magazine website within the past week, and 33.7% indicated that they had viewed a magazine website in the past month. In contrast, the weekly and monthly incidence levels of reading a printed copy of a magazine were 38.3% and 64.0%, respectively. Although less pronounced, higher weekly and monthly incidence levels were found for printed publications even when the data were adjusted to take into account the difference in past six-month usage rates for printed and online publications.
The frequency of viewing a newspaper website was substantially higher than the frequency of viewing a magazine website, but considerably lower than the frequency of reading any printed newspaper. When respondents were asked how often they viewed a newspaper website in the past six months:
-
-
- 34.6% indicated that they had viewed a newspaper website within the past week; and
- 51.8% indicated that they had viewed a newspaper website in the past month.
-
In contrast, the weekly and monthly incidence levels of reading a printed copy of any newspaper were 52.4% and 66.9%, respectively. Again, higher weekly and monthly incidence levels were found even after the data were adjusted to take into account the difference in past six-month usage levels for printed and online publications.
Possible Alternatives
Key to understanding if an acceptable alternative exists to someone’s current reading behavior is to understand the satisfaction that exists for that behavior, how they make their reading choice, and what they do as a result of that choice.
Satisfaction
An examination of the satisfaction levels for online and printed magazines revealed that both were fairly high. When respondents who viewed a magazine website in the past six months were asked to use a five-point scale ranging from “very satisfied” to very dissatisfied” to rate their degree of satisfaction with these sites, 71.4% indicated that they were either “very” or “somewhat” satisfied”. The level of satisfaction was only slightly lower than the satisfaction level found for reading printed magazines (78.5% very/somewhat satisfied).
Similarly, the satisfaction levels for both online and printed newspapers were fairly high, and similar to the levels found for magazines. Specifically, the top 2-box satisfaction level (very/somewhat satisfied) for online newspapers was 70.8%, and the top 2-box level for printed newspapers was 76.2%.
Accessing Publication Websites
For each online publication read in the study, respondents were asked how they usually accessed the website. As can be seen in Table 2, the most commonly used method to access a publication website was to use a search engine (44.3%), followed by a bookmark (35.2%) and a URL (20.6%). An analysis of the results by publication type revealed that the relative importance of each of these three methods was the same for all publication types, except “Sports”. Thus it appears that accessing online publications isn’t a daily ritual or routine. Rather, it appears to be “inquiry-based”, i.e., it is based on a need for specific information.
| T a b l e 2
H o w P u b l i c a t i o n W e b s i t e I s U s u a l l B a s e = T h o s e W h o V i s t e d P u b l i c a t i o n |
y A c c e s ‘ W e | s s e d b s i t e | s | |
| S e a r c h E n g i n e | B o o k M a r k | U R L | ||
| A v e r a g e ( 4 0 P u b l i c a t i o n s ) | 4 4 . 3 % | 3 5 . 2 % | 2 0 . 6 % | |
| B u s i n e s s | 4 5 . 7 % | 3 6 . 8 % | 1 7 . 5 % | |
| E n t e r t a i n m e n t | 4 6 . 8 % | 3 2 . 8 % | 2 0 . 3 % | |
| G e n e r a l I n t e r e s t | 4 0 . 9 % | 3 7 . 6 % | 2 1 . 5 % | |
| G o u r m e t | 4 6 . 7 % | 3 3 . 6 % | 1 9 . 7 % | |
| M e n ‘ s | 4 3 . 0 % | 3 5 . 3 % | 2 1 . 8 % | |
| N e w s p a p e r | 4 4 . 8 % | 3 3 . 3 % | 2 1 . 8 % | |
| N e w s w e e k l y | 5 2 . 0 % | 2 8 . 4 % | 1 9 . 7 % | |
| S h e l t e r | 4 1 . 5 % | 3 7 . 6 % | 2 0 . 9 % | |
| S p o r t s | 3 9 . 1 % | 4 1 . 8 % | 1 9 . 1 % | |
| W o m e n ‘ s | 4 3 . 1 % | 3 4 . 1 % | 2 2 . 8 % | |
Activities Resulting from Reading/Viewing Publication
As can be seen in Table 3, when the online version of a publication was read or looked into, there was a somewhat greater likelihood of people engaging in at least one activity than when the printed version was read or looked into. This was particularly true for:
-
-
-
- Dining in restaurants;
- Visiting a publication’s website for more information;
- Recommending the publication to someone else; and
- Recommending a product/restaurant/service/store to someone else.
-
-
In contrast, when the printed version was read or looked into, people were more likely to:
-
-
-
- Save items of interest;
- Pass the publication along to someone else;
- Shop for an item in a store mentioned or advertised in the publication, and
- Discuss something read with another person.
-
-
| Table 3
Actions Taken In Last 6 Months As A Result of Reading Publication Base=Those Who Used Publication Version |
|||
| Printed Version | Online Version | Online Relative Index | |
| Did Something (Net) | 68.1% | 73.4% | 108 |
| -Saved items of interest/Printed items of interest | 14.3% | 11.6% | 81 |
| -Dined in a restaurant | 4.2% | 7.2% | 170 |
| -Discussed something read with another person | 23.0% | 20.9% | 91 |
| -Passed publication along to someone else/E-mailed or sent an article to someone else | 14.1% | 9.2% | 65 |
| -Visit publication’s website for more information | 8.6% | 16.2% | 188 |
| -Recommended publication to someone else | 10.0% | 17.5% | 174 |
| -Recommended a product/restaurant/service/store to someone else | 5.5% | 8.9% | 160 |
| -Saved one or more issues | 15.0% | NA | —– |
| -Shopped for an item or in a store mentioned or advertised in publication | 8.6% | 7.5% | 87 |
| -Other | 6.3% | 3.9% | 62 |
| None of these | 31.9% | 26.6% | 83 |
Seeking Information
To better understand reader motivations for using a particular medium, respondents in the study were asked to indicate the medium they usually selected to find out information about the following topic areas:
-
-
- General news;
- Business/financial news;
- Entertainment/celebrity news;
- Travel;
- Sports;
- Fashion; and
- Home and Garden.
-
As can be seen by examining Table 4, with the exception of fashion, the Internet and television were the two media that people usually went to for information. As can also be seen by examining this table, the printed versions of both magazines and newspapers were selected much more often than the online versions as a typical informational source for each of the seven topic areas.
| Table 4
Medium Usually Selected to Find Information About Specific Topic Areas Base=Adults 18+ |
|||||||
| General News | Business News | Enter- tainment | Travel | Sports | Fashion | Home & Garden | |
| Internet | 57.7% | 35.4% | 39.4% | 47.3% | 36.5% | 21.0% | 30.4% |
| TV | 67.2% | 30.3% | 37.9% | 14.0% | 43.2% | 15.1% | 26.1% |
| Radio | 33.4% | 11.2% | 12.0% | 3.3% | 16.1% | 1.9% | 2.4% |
| Printed or hard copy magazines
Magazine website online Printed to Online Magazine Ratio |
15.7%
8.2% 1.90 |
8.9%
4.1% 2.16 |
19.1%
12.8% 1.49 |
8.7%
3.2% 2.69 |
9.1%
3.7% 2.49 |
15.9%
7.6% 2.10 |
20.8%
7.6% 2.75 |
| Printed or hard copy newspapers
Newsletter website online Printed to Online Newspaper Ratio |
43.1%
32.5% 1.33 |
22.1%
11.6% 1.91 |
13.1%
7.4% 1.78 |
8.6%
4.3% 1.99 |
20.1%
11.3% 1.77 |
5.5%
2.5% 2.21 |
9.7%
3.2% 3.01 |
| Printed or hard copy newsletters | 13.5% | 4.8% | 3.0% | 3.3% | 3.9% | 1.8% | 3.4% |
| Newsletter website online | 15.3% | 6.2% | 4.8% | 4.3% | 5.1% | 2.2% | 5.1% |
| Cell/mobile phone | 8.1% | 3.7% | 2.7% | 2.6% | 3.0% | 1.5% | 0.9% |
| Smartphone | 9.3% | 4.8% | 3.2% | 2.5% | 4.1% | 1.1% | 1.2% |
| Do not seek information on this topic | 6.3% | 34.8% | 32.1% | 36.8% | 38.1% | 57.4% | 40.9% |
Version Preference – Online Vs. Print
Respondents in the study who read or looked into both the printed and online versions of the same publication were asked which version they preferred. Although the printed version was preferred more often than the online version (37.0% vs. 28.7%), this difference was not pronounced. More importantly, 34.4% had no preference.
As can be seen in Table 5, an analysis of preference by publication type revealed that version preference varied to some degree by publication type. For example, preference for the printed version over the online version was most pronounced for:
-
-
- Shelter publications;
- General interest publications;
- Entertainment publications;
- Sports publications; and
- Men’s publications.
-
In contrast, for gourmet and newsweekly publications, the online version was preferred over the printed version, and for business publications and newspapers there was little difference in preference.
| T a V e r s i o n
B a s e = T h o s e W h o U s e d B o t h |
b l e P r e V e | 5
f e r e n c e r s i o n s o f S |
a m | e | P | u | b l i c a t i o n | |||||
| P r i n t e | d | O n l i n | e | P | N o
r e f e r e n |
c e | ||||||
| A v e r a g e ( 4 0 P u | b l i c a t i o n | s ) | 3 7 . 0 % | 2 8 . 7 % | 3 4 . 4 % | |||||||
| B u s i n e s s | 3 1 . 5 % | 3 1 . 3 % | 3 7 . 2 % | |||||||||
| E n t e r t a i n m e n t | 4 3 . 7 % | 2 4 . 6 % | 3 1 . 7 % | |||||||||
| G e n e r a l I n t e r e s t | 4 3 . 8 % | 2 3 . 7 % | 3 2 . 5 % | |||||||||
| G o u r m e t | 2 6 . 4 % | 3 9 . 8 % | 3 3 . 7 % | |||||||||
| M e n ‘ s | 3 8 . 6 % | 2 7 . 2 % | 3 4 . 2 % | |||||||||
| N e w s p a p e r | 3 5 . 0 % | 3 4 . 3 % | 3 0 . 8 % | |||||||||
| N e w s w e e k l y | 2 3 . 6 % | 3 5 . 2 % | 4 1 . 2 % | |||||||||
| S h e l t e r | 4 4 . 0 % | 2 0 . 5 % | 3 5 . 5 % | |||||||||
| S p o r t s | 4 2 . 4 % | 2 7 . 6 % | 3 0 . 0 % | |||||||||
| W o m e n ‘ s | 3 6 . 3 % | 2 9 . 8 % | 3 3 . 8 % | |||||||||
What if the Printed Version Were no Longer Available
For each printed version of a publication that was read in the past six months, respondents were asked what they would do if the printed version were no longer available and the only option they would have to read the publication was to view and read it on the publication’s website. On average, across the 40 publications included in the study,
-
-
-
- 37.9% indicated that they would use the publication’s website to continue to get the publication;
- 31.2% indicated that they would find and read another publication that covered similar topics; and
- 30.9% indicated that they would find something else to do with their time.
-
-
As would be expected, those who did not read any of the 40 measured print publications online were less likely than those who did to indicate that they would use the publication’s website (31.2% vs. 42.9%).
An analysis of the results by publication type revealed that the responses to the question varied (to some degree) by type. Specifically, as can be seen in Table 6, the likelihood of viewing the publication’s website if the printed version were no longer available was somewhat greater for:
-
-
-
- Sports publications;
- Newspapers;
- General interest publications;
- Gourmet publications; and
- Men’s publications.
-
-
| Table 6
What Would You Do If Printed Version Was Not Available? Base=Those Who Read Printed Versions of Publications |
|||
| Use Website | Read Another Publicaiton | Find
Something Else To Do |
|
| Average (40 Publications) | 37.9% | 31.2% | 30.9% |
| Business | 37.5% | 35.6% | 26.9% |
| Entertainment | 37.7% | 28.5% | 33.8% |
| General Interest | 41.5% | 26.7% | 31.9% |
| Gourmet | 40.9% | 28.9% | 30.2% |
| Men’s | 40.6% | 31.8% | 27.6% |
| Newspaper | 41.3% | 33.6% | 25.1% |
| Newsweekly | 33.5% | 33.7% | 32.7% |
| Shelter | 32.9% | 33.0% | 34.1% |
| Sports | 46.1% | 23.6% | 30.4% |
| Women’s | 36.0% | 31.7% | 32.3% |
Reader Composition
Table 7 compares and contrasts the demographic profiles of three reader groups to the demographic profile of the total sample. The three analytical groups included print only users, online only users, and those who used both the online and the printed versions of at least one of the 40 publications measured in the study, but not necessarily the same publication. In addition to showing the percent each demographic segment represents of each of the three groups and the segment’s index, Table 7 also shows the relationship between segment and group membership, expressed in terms of a phi coefficient.
Examination of this table shows that, relative to the total sample, those who read both the printed and online versions of publications are more likely to:
-
-
- Be male;
- Be between the ages of 18 and 24;
- Be more affluent;
- Be a student;
- Be single or separated;
- Live in larger size households;
- Live in the South Census Region;
- Be Asian/Pacific islander;
- Have 4 or more years of college; and
- Have children (specifically 1 child).
-
Relative to the total sample, online only users are more likely to:
-
-
- Be male;
- Be between the ages of 45 and 64;
- Be less affluent;
- Not be employed either full- or part-time;
- Be a student;
- Be single, widowed or divorced;
- Live in larger size households;
- Live in the Midwest or Northeast Census Regions;
- Be non-white;
- Be less well educated; and
- Have children (especially 3 or more).
-
Relative to the total sample, print only readers are more likely to:
-
-
- Be female;
- Be 65 years of age or older;
- Be retired or homemakers;
- Be widowed, divorced, or living in a domestic partnership;
- Live in smaller size households;
- Live in the West Census Region;
- Be white; and
- To have no children under the age of 18.
-
Viability of Paying for Content
Paying for Subscriptions & Download Fees
The percentage of people who reported that they paid for any subscription or any download fees for any online or digital content in the past six months was relatively low among the total sample (10.3%), and particularly among the “print only” group (7.7%).
Perceived Value of Online Publications among Online Subscribers
Respondents in the study who subscribed to the online version of the Wall Street Journal and respondents who subscribed to the online version of Consumer Reports were asked to use a five-point scale to rate each publication in terms of value. For both publications, the overwhelming majority said it was either an excellent, very good, or good value for the money. Specifically, on average, across the two publications:
-
-
-
- 22.6% rated the publications as an excellent value;
- 32.3% rated the publications as a very good value;
- 26.6% rated the publications as a good value;
- 15.3% rated the publications as a fair value; and
- 3.2% rated the publications as a poor value.
-
-
Paying for Online Content
But despite these high satisfaction levels, when respondents were asked if magazines and newspapers charged for their online content in the future, how likely they would be to pay for the content, only 16.5% said extremely, very, or somewhat likely. Specifically:
-
-
-
- 2.2% responded extremely likely;
- 5.9% responded very likely;
- 8.4% responded somewhat likely;
- 11.6% responded neither likely nor unlikely;
- 9.5% responded somewhat unlikely;
- 12.7% responded very unlikely;
- 42.8% responded extremely unlikely; and
- 6.8% did not know.
-
-
Satisfaction & Frequency of Use
As mentioned previously, with the advent of the Internet and other technological innovations, content traditionally associated with print is now available in forms other than books, magazines and newspapers. In order to get a handle on these alternatives to traditional print, respondents in the study were asked how frequently they used these alternatives and, if they did, to indicate their level of satisfaction using a five point scale ranging from “very satisfied” to “very dissatisfied”. To provide a frame of reference, online and printed magazines and newspapers were also included in this question sequence.
As can be seen by examining Table 8, printed newspapers and printed magazines ranked:
-
-
-
- First and third, respectively, in terms of weekly reach;
- First and second, respectively, in terms of monthly reach; and
- Fourth and second, respectively, in terms of satisfaction.
-
-
Other activities that had at least a 30% monthly reach include social networks, printed newsletters, reading blogs, and viewing newsletter websites, all of which, with the exception of reading blogs, had top 2-box satisfaction levels of at least 63%.
| Table 7
Demographic Profiles of Three Print Readership Groups Vs. Total Adults Base=Adults 18+ |
||||||||||||
| Percents | Indices | Phi Coefficient | ||||||||||
| Adults | Print Only | Online Only | Both Print & Online | Adults | Print Only | Online Only | Both Print & Online | Adults | Print Only | Online Only | Both Print & Online | |
| Sample | (2402) | (1072) | (94) | (964) | (2402) | (1072) | (94) | (964) | (2402) | (1072) | (94) | (964) |
| Weighted | 2402 | 978 | 116 | 893 | 2402 | 978 | 116 | 893 | 2402 | 978 | 116 | 893 |
| Demographic Profiles – Sex | ||||||||||||
| Male | 48.5% 41.4% 63.9% 54.2% | 100 | 85 | 132 | 112 | —– | -0.12 | 0.07 | 0.09 | |||
| Female | 51.5% 58.6% 36.1% 45.8% | 100 | 114 | 70 | 89 | —– | 0.12 | -0.07 | -0.09 | |||
| Demographic Profiles – Age | ||||||||||||
| Mean | 45.5 48.4 45.4 43.7 | 100 | 106 | 100 | 96 | —– | —– | —– | —– | |||
| 18-24 | 8.9% 5.2% 10.6% 12.5% | 100 | 59 | 119 | 141 | —– | -0.11 | 0.01 | 0.10 | |||
| 25-34 | 21.6% 19.8% 16.3% 21.8% | 100 | 92 | 76 | 101 | —– | -0.04 | -0.03 | 0.00 | |||
| 35-44 | 18.7% 18.1% 15.8% 18.0% | 100 | 97 | 84 | 96 | —– | -0.01 | -0.02 | -0.01 | |||
| 45-54 | 19.6% 19.8% 28.1% 19.7% | 100 | 101 | 144 | 101 | —– | 0.00 | 0.05 | 0.00 | |||
| 55-64 | 14.8% 12.2% 20.5% 16.8% | 100 | 82 | 138 | 113 | —– | -0.0б | 0.04 | 0.04 | |||
| 65+ | 16.4% 24.9% 8.7% 11.2% | 100 | 152 | 53 | 68 | —– | 0.19 | -0.05 | -0.11 | |||
| Demographic Profiles – Household Income | ||||||||||||
| Mean | $65,748 $66,251 $56,977 $75,198 | 100 | 101 | 87 | 114 | —– | —– | —– | —– | |||
| Under $25,000 | 24.9% 24.6% 37.5% 20.5% | 100 | 99 | 151 | 83 | —– | 0.00 | 0.07 | -0.08 | |||
| $25,000 to $49,999 | 24.8% 22.7% 12.1% 22.3% | 100 | 92 | 49 | 90 | —– | -0.04 | -0.07 | -0.04 | |||
| $50,000 to $74,999 | 18.1% 19.1% 20.9% 19.2% | 100 | 105 | 116 | 106 | —– | 0.02 | 0.02 | 0.02 | |||
| $75,000 to $99,999 | 11.9% 13.5% 12.0% 12.2% | 100 | 113 | 101 | 103 | —– | 0.04 | 0.00 | 0.01 | |||
| $100,000 to $124,999 | 7.9% 8.1% 9.8% 8.7% | 100 | 102 | 124 | 110 | —– | 0.01 | 0.02 | 0.02 | |||
| $125,000 to $149,999 | 4.4% 4.1% 2.6% 5.8% | 100 | 94 | 60 | 133 | —– | -0.01 | -0.02 | 0.05 | |||
| $150,000 to $174,999 | 2.9% 2.9% 2.8% 3.8% | 100 | 100 | 98 | 132 | —– | 0.00 | 0.00 | 0.04 | |||
| $175,000 to $199,999 | 1.6% 1.7% 0.9% 2.0% | 100 | 108 | 56 | 125 | —– | 0.01 | -0.01 | 0.02 | |||
| $200,000 to $249,999 | 1.7% 1.5% 0.8% 2.6% | 100 | 91 | 46 | 153 | —– | -0.01 | -0.02 | 0.05 | |||
| $250,000 or more | 2.0% 1.8% 0.6% 3.0% | 100 | 92 | 30 | 154 | —– | -0.01 | -0.02 | 0.0б | |||
| Demographic Profiles – Employment | ||||||||||||
| Employed Full-time | 42.0% 41.9% 34.6% 43.9% | 100 | 100 | 82 | 105 | —– | 0.00 | -0.03 | 0.03 | |||
| Employed Part-time | 8.1% 7.8% 6.3% 7.7% | 100 | 96 | 77 | 95 | —– | -0.01 | -0.02 | -0.01 | |||
| Self-Employed | 6.7% 7.2% 8.5% 6.5% | 100 | 107 | 127 | 97 | —– | 0.02 | 0.02 | -0.01 | |||
| Homemaker | 10.1% 12.3% 3.7% 8.8% | 100 | 121 | 36 | 87 | —– | 0.0б | -0.05 | -0.03 | |||
| Student | 4.6% 1.3% 6.4% 8.1% | 100 | 29 | 138 | 176 | —– | -0.13 | 0.02 | 0.13 | |||
| Retired | 17.9% 22.7% 24.8% 14.6% | 100 | 127 | 139 | 82 | —– | 0.11 | 0.04 | -0.0б | |||
| Currently Unemployed | 9.8% 6.0% 15.8% 9.4% | 100 | 61 | 161 | 96 | —– | -0.11 | 0.05 | -0.01 | |||
| Other | 0.8% 0.8% 0.0% 1.0% | 100 | 104 | 0 | 132 | —– | 0.00 | -0.02 | 0.02 | |||
| Demographic Profiles – Marital Status | ||||||||||||
| Single | 21.1% 12.2% 25.1% 25.2% | 100 | 58 | 119 | 120 | —– | -0.18 | 0.02 | 0.08 | |||
| Married | 55.0% 57.8% 54.0% 55.4% | 100 | 105 | 98 | 101 | —– | 0.05 | 0.00 | 0.01 | |||
| Domestic Partnership | 7.2% 8.7% 0.4% 5.9% | 100 | 122 | 6 | 82 | —– | 0.05 | -0.0б | -0.04 | |||
| Widowed | 5.8% 7.8% 9.3% 4.7% | 100 | 134 | 160 | 81 | —– | 0.07 | 0.03 | -0.04 | |||
| Divorced | 8.9% 11.3% 10.6% 6.0% | 100 | 126 | 119 | 68 | —– | 0.07 | 0.01 | -0.08 | |||
| Separated | 2.1% 2.3% 0.7% 2.8% | 100 | 112 | 34 | 135 | —– | 0.01 | -0.02 | 0.04 | |||
| Table 7 Cont.
Demographic Profiles of Three Print Readership Groups Vs. Total Adults Base=Adults 18+ |
||||||||||||
| Percents | Indices | Phi Coefficient | ||||||||||
| Adults | Print Only | Online Only | Both Print & Online | Adults | Print Only | Online Only | Both Print & Online | Adults | Print Only | Online Only | Both Print & Online | |
| Sample | (2402) | (1072) | (94) | (964) | (2402) | (1072) | (94) | (964) | (2402) | (1072) | (94) | (964) |
| Weighted | 2402 | 978 | 116 | 893 | 2402 | 978 | 116 | 893 | 2402 | 978 | 116 | 893 |
| Demographic Profiles – Household Size | ||||||||||||
| Mean | 2.9 | 2.8 | 3.4 | 3.1 | 100 | 94 | 116 | 104 | —– | —– | —– | —– |
| One | 14.3% | 12.8% | 12.0% | 13.6% | 100 | 89 | 84 | 95 | —– | -0.04 | -0.02 | -0.02 |
| Two | 33.7% | 38.4% | 36.3% | 31.1% | 100 | 114 | 108 | 92 | —– | 0.08 | 0.01 | -0.04 |
| Three | 19.4% | 24.0% | 12.6% | 15.7% | 100 | 124 | 65 | 81 | —– | 0.10 | -0.04 | -0.07 |
| Four | 17.6% | 13.6% | 16.1% | 23.1% | 100 | 77 | 91 | 132 | —– | -0.09 | -0.01 | 0.11 |
| Five or more | 15.0% | 11.2% | 23.0% | 16.5% | 100 | 75 | 154 | 110 | —– | -0.09 | 0.05 | 0.03 |
| Demographic Profiles – Census Region | ||||||||||||
| Northeast | 18.5% | 18.6% | 26.2% | 18.3% | 100 | 100 | 142 | 99 | —– | 0.00 | 0.04 | 0.00 |
| Midwest | 21.9% | 23.2% | 33.7% | 19.3% | 100 | 106 | 154 | 88 | —– | 0.03 | 0.0б | -0.05 |
| South | 36.5% | 32.0% | 21.0% | 40.4% | 100 | 88 | 58 | 111 | —– | -0.08 | -0.07 | 0.0б |
| West | 23.1% | 26.3% | 19.1% | 22.0% | 100 | 114 | 83 | 95 | —– | 0.0б | -0.02 | -0.02 |
| Demographic Profiles – Race | ||||||||||||
| White | 81.3% | 87.4% | 60.1% | 79.8% | 100 | 107 | 74 | 98 | —– | 0.13 | -0.12 | -0.03 |
| Black | 11.7% | 9.5% | 27.5% | 9.3% | 100 | 81 | 235 | 80 | —– | -0.0б | 0.11 | -0.0б |
| Asian or Pacific Islander | 4.6% | 1.6% | 7.8% | 8.6% | 100 | 36 | 170 | 188 | —– | -0.12 | 0.03 | 0.15 |
| Native American or Alaskan Native | 0.3% | 0.0% | 0.5% | 0.4% | 100 | 6 | 177 | 137 | —– | -0.04 | 0.01 | 0.01 |
| Mixed racial background | 0.5% | 0.4% | 3.6% | 0.4% | 100 | 83 | 696 | 72 | —– | -0.01 | 0.10 | -0.02 |
| Other | 1.2% | 0.9% | 0.5% | 0.9% | 100 | 76 | 40 | 69 | —– | 0.00 | -0.02 | 0.02 |
| Declined to answer | 0.4% | 0.1% | 0.1% | 0.7% | 100 | 25 | 30 | 181 | —– | -0.04 | -0.01 | 0.04 |
| Demographic Profiles – Hispanic Descent | ||||||||||||
| Yes | 13.7% | 11.4% | 8.2% | 14.8% | 100 | 83 | 60 | 108 | —– | -0.0б | -0.04 | 0.03 |
| No | 86.3% | 88.6% | 91.8% | 85.2% | 100 | 103 | 106 | 99 | —– | 0.0б | 0.04 | -0.02 |
| Demographic Profiles – Education | ||||||||||||
| Grade School | 0.6% | 0.2% | 2.8% | 0.5% | 100 | 40 | 496 | 98 | —– | -0.04 | 0.07 | 0.00 |
| Some High School | 4.9% | 6.1% | 2.9% | 3.4% | 100 | 123 | 58 | 69 | —– | 0.04 | -0.02 | -0.05 |
| Graduated High School | 39.7% | 43.1% | 56.1% | 31.1% | 100 | 109 | 141 | 78 | —– | 0.0б | 0.08 | -0.14 |
| Completed Technical or Vocational School | 0.7% | 0.4% | 0.3% | 0.8% | 100 | 52 | 38 | 117 | —– | -0.03 | -0.01 | 0.01 |
| Some College | 21.0% | 15.6% | 11.3% | 25.3% | 100 | 74 | 54 | 121 | —– | -0.11 | -0.05 | 0.08 |
| Graduated from college – 2 year | 7.9% | 8.9% | 9.3% | 7.3% | 100 | 113 | 119 | 93 | —– | 0.03 | 0.01 | -0.02 |
| Graduated from college – 4 years or more | 23.6% | 24.2% | 14.6% | 29.6% | 100 | 103 | 62 | 126 | —– | 0.01 | -0.05 | 0.11 |
| -Graduated from college – 4 year | 14.5% | 15.2% | 6.9% | 18.3% | 100 | 105 | 48 | 126 | —– | 0.02 | -0.05 | 0.08 |
| -Some Post Graduate | 2.8% | 2.3% | 1.2% | 3.3% | 100 | 82 | 43 | 118 | —– | -0.03 | -0.02 | 0.02 |
| -Post Graduate Degree | 6.2% | 6.7% | 6.4% | 7.9% | 100 | 107 | 102 | 127 | —– | 0.01 | 0.00 | 0.05 |
| Demographic Profiles – Number of Kids In HH | ||||||||||||
| Mean | 0.73 | 0.58 | 1.46 | 0.81 | 100 | 80 | 200 | 111 | —– | —– | —– | —– |
| No Children | 46.9% | 55.4% | 31.9% | 36.7% | 100 | 118 | 68 | 78 | —– | 0.14 | -0.07 | -0.1б |
| 1 Child | 37.9% | 32.5% | 26.4% | 49.1% | 100 | 86 | 70 | 130 | —– | -0.09 | -0.05 | 0.18 |
| 2 Children | 10.9% | 10.7% | 5.5% | 11.1% | 100 | 98 | 51 | 102 | —– | -0.01 | -0.04 | 0.01 |
| 3+ Children | 4.3% | 1.4% | 36.2% | 3.1% | 100 | 34 | 846 | 72 | —– | -0.12 | 0.3б | -0.05 |
| Table 8
Incidence of Use & Satisfaction of Various Activites & Print Alternatives Base=Adults 18+ |
||||
| Used Past Week | Used Past Month | Did Not Use In Past
6 Months |
2-Box Satis- faction
Rating* |
|
| Visit a magazine’s website online | 18.0% | 33.7% | 54.0% | 71.4% |
| Read printed or hard copy magazines | 38.3% | 64.0% | 27.9% | 78.5% |
| View a newspaper’s website online | 34.6% | 51.8% | 37.5% | 70.8% |
| Read printed or hard copy newspapers | 52.4% | 66.9% | 24.9% | 76.2% |
| View a newsletter’s website online | 19.1% | 33.0% | 57.0% | 68.2% |
| Read printed or hard copy newsletters | 22.1% | 40.5% | 48.2% | 63.1% |
| View RSS feeds online | 8.7% | 13.8% | 80.2% | 53.4% |
| Use an e-reader | 4.5% | 6.5% | 91.0% | 47.6% |
| Listen to podcasts | 8.2% | 15.0% | 79.0% | 61.9% |
| Read blogs | 21.9% | 33.3% | 55.2% | 58.9% |
| Post blogs | 7.8% | 15.5% | 78.6% | 73.0% |
| “Tweet” via Twitter | 8.9% | 12.3% | 83.8% | 51.3% |
| Visit major social networks | 48.1% | 56.7% | 37.4% | 72.5% |
| Order movies via mail | 16.1% | 23.2% | 74.8% | 82.3% |
| Order movies via downloading | 7.2% | 14.6% | 82.1% | 68.8% |
| Purchase downloads | 9.5% | 19.4% | 68.7% | 71.0% |
| Watch television reruns on your computer | 17.1% | 26.6% | 64.5% | 77.8% |
*Very/Somewhat Satisfied
Conclusions & Discussion
Synergy – Simultaneous Usage of Printed & Online Versions
The results of the present study clearly show that there is not a great deal of synergy between publications’ printed versions and their online website. Among past six-month readers, only 14.5%, on average, indicated that they read the printed version and viewed the website of the same publication. Moreover, an analysis of the results by publication type revealed that this was true for all publication types, ranging from a low of 10.6% for general interest publications, to a high of 17.8% for business publications.
Although readership of both the printed and online versions of the same publication were low, online readership, in general, accounted for a sizeable minority of past six-month readers. On average, across the 40 publications included in the study, online readers accounted for 38.5% of past six-month readers. This level, however, varied substantially by publication type – ranging from a low of 28.6% for shelter magazines to 51% for newspapers.
Usage and Evaluation of Possible Alternatives to Magazines & Newspapers
Based on current usage rates and satisfaction levels, there appear to be a number of “other” activities and behaviors that represent a challenge for magazines and newspapers, either as a means of providing alternative print content and/or in terms of competing for people’s time. The most notable of which is visiting major social networks, which has a weekly incidence level higher than that for printed magazines (48.1% vs. 38.3%), and a top 2-box satisfaction level just slightly lower than printed magazines (72.5% vs. 76.2%). Other “alternatives” that currently have weekly incidence levels in excess of 15% and top 2-box satisfaction scores of at least 60% include:
-
-
- Reading printed newsletters;
- Viewing online newsletters;
- Watching TV re-runs on the computer; and
- Ordering movies via mail.
-
Demographic Comparison of Online and Print Readers
The composition of online only readers is quite different than that of the print only or the print and online readers. Those persons who only read online represent a small universe and are not necessarily a demographically appealing market; they are by far the least affluent and least well educated of the three analytical segments.
Viability of Charging for Online Publications
At the current time, it is very difficult to determine if people will be willing to pay for online publications in the future. People are not used to paying for online print content as evidenced by the fact that only 10.3% of the total sample paid any subscription or download fees for any online or digital content in the past six months; Moreover, only 16.5% indicated that they are extremely, very, or somewhat likely to pay for online publication content in the future. Additional evidence that suggests consumers may not be receptive to paying for online publications includes the lack of synergy between online and print readership, and the lower average frequency of accessing a publication’s website compared to that of reading the publication’s printed version (even when the data are adjusted to take into account the fact that more people read printed publications than visit their websites). Still other factors that do not favor online publications include:
-
-
-
- The median reported time spent reading online publications is about half that of printed publications;
- Printed publications are selected by more than a margin of two-to-one over online publications as a usual source of information for seven topic areas; and
- More than six in ten respondents indicated that they would read another publication or do something else if the only way they could access the publication was online.
-
-
On the positive side, the online reader is an attractive audience. Though they represent a sizeable minority of past six-month readers, those who use both printed and online versions of publications are younger and better educated than the general population and “print only” readers. Additionally, satisfaction with print and newspaper websites is high and almost on a par with printed versions of the publications, and the likelihood of taking any action as a result of reading a publication is somewhat greater for online publications than for printed publications. Other factors that bode well for online publications include:
-
-
-
- Among those who read or look into both the printed and online versions of the same publication, almost two-in-three prefer the online version or have no preference; and
- An overwhelming majority of those who currently subscribe to the online versions of the Wall Street Journal or Consumer Reports indicated that these subscriptions are a good value for the money.
-
-
In reviewing the above points regarding online publications, it appears that, on the surface, the negatives outweigh the positives. However, it must be kept in mind that two publications have been successful in monetizing their websites and, in so doing, have led customers to report that they are getting a good value for the money.
In order to successfully monetize a website, publishers should conduct research among their current and potential customer bases to determine the business model and options that maximize online revenue. Key questions that must be answered are:
-
-
-
- How much should be charged for accessing the publication’s website?
- Should access to the website be restricted to subscribers, or should certain content be free?
- How different should the online content be from the printed content?
- Should subscriptions for the printed and online versions be bundled?
- If so, how much more should be charged for online access?
- What should be the duration of these subscriptions?
- Should there be a penalty for terminating these subscriptions prior to the expiration date?
-
-
Appendix
-
-
- For each of 40 publications:
-
o When was the last time, if ever, the publication was read or looked into?
-
-
- For each publication that was read or looked into in the past six months:
-
o What version or format (online vs. printed) was read or looked into?
-
-
- For each publication for which the printed version was read or looked into:
-
- How the copy was usually obtained?
- How much time was spent, in total, reading or looking into the printed issue?
- What actions, if any, were taken in the last six months as a result of reading the printed issue?
o What would be done if the printed version was no longer available and the only option to continue to get the publication was to view it online on the publication’s website?
-
-
- For each publication for which the online version was read or looked into:
-
- How the publication’s website was usually accessed?
- How much time was spent, in total, viewing the publication’s website?
- What actions, if any, were taken in the last six months as a result of viewing the publication’s website?
-
- For each publication that was read or looked into both online and in printed format:
-
o Which version was preferred?
-
-
- For those who currently subscribe to the Wall Street Journal or Consumer Reports online versions:
-
o What was the perceived value of the online subscription?
In addition to the above line of inquiry, each respondent was asked a series of questions to determine:
-
-
- The incidence of paying for subscriptions or download fees for any online content in the past six months
- The likelihood of paying for magazine and newspaper content online
- Where people usually go to seek information about:
-
- General news
- Business/financial news
- Entertainment/celebrity news
- Travel
- Sports
- Fashion
- Home and Garden
-
- The frequency of engaging in each of the following activities in the past six months:
-
- Viewing a magazine’s website online
- Reading printed or hard copy magazines
- Viewing a newspaper’s website online
- Reading printed or hard copy newspapers
- Viewing a newsletter’s website online
- Reading printed or hard copy newsletters
- Viewing RSS feeds online
- Using an e-reader (e.g., Kindle, Sony Reader Digital Book, etc.)
- Listening to podcasts
- Reading blogs
- Posting blogs
- “Tweeting” via Twitter
- Visiting major social networks (e.g., Facebook, MySpace, etc.)
- Ordering movies via mail (e.g., Netflix, Blockbuster Online, etc.)
- Ordering movies via downloading (e.g., Netflix, Blockbuster Online, etc.)
- Purchasing downloads (e.g., iTunes, Amazon.com)
- Watching television re-runs on the computer (e.g., Hulu)
-
- Satisfaction with each of these activities among those who participated in the activity at least once in the past six months
-