Alexandre Crivellaro and Leticia Gimenez, IBOPE Media
Andréa Costa do Nascimento and Dimas Mileto, Editora Abril
Worldwide Readership Research Symposium Valencia 2009 Session 2.7
Abstract
The present paper aims to demonstrate that online research (especially those that are carried out in the same environment the internet users access the content) may offer a higher understanding of a determined target, since it enables fast data gathering. However, when combined and fused with conventional single source research (which is more extensible), may lead to a data with further (and deeper) analysis potential. The combination of a huge amount of data collected in online researches and more detailed sampling processes of the conventional research is something that saves time and money compared to a unique method of collection.
In this paper we will present results comparing both individual and fused databases. We will go through the processes that are necessary to accomplish the final results, and also show how important is data merging for such analysis and how they would contribute to the development of new business models for selling ads combining online and traditional methods. In the end, we will show how research institutes can use similar methods to offer different and customized products for their clients.
– Introduction
With the birth of the internet in the 90’s and the ever growing development of information technology, new opportunities and challenges emerged for companies that investigate the media environment. Since these opportunities are directly connected to tech development we may assume that data management became easier to research companies’ side. On the other hand, by the consumer´s side, it enables access to endless forms of communication and entertainment online.
In the last Worldwide Readership Research Symposium (WRRS 2007), John Faase focused on the challenges currently faced by the media measurement market. In particular, he presented the case of Sanoma, one of the largest magazine publishers in the Netherlands which, in his words, migrated to multi-media sales. “Publishers are investing in online publications to service their existing readers, to attract new readers (and viewers!), to protect existing streams of advertising revenues and to create new sources of income. Many of the early online publications by print media were conceived as more or less facsimiles of the existing newspaper or magazine. (…) Nowadays, newspaper and magazine websites bear little resemblance to the original printed product. They are aspiring to form communities of readers. That is, if they still are readers. Some newspapers are providing more video content online than the average television station” [18].
This discussion may lead us to a debate of the current printed (and online) press and also to a different analysis of media consumption. On the World Wide Web, we don’t know exactly how to distinguish a magazine from a newspaper and sometimes even a TV station. In this paper we will be focusing on this differentiation problem.
The multiplication of medium and vehicles creates a complex network for content consumption that has to be measured and understood. The concept of using information from trustful sources and publishing it in traditional media has broadened. The use of social networks, in which the readers organize themselves in interactive and complex communities, open the way to criticism, analysis and even for content production. We are leaving behind the model of a single trustful content generator for many receptors and replacing it for a model with many generators for multiple receptors. This model has been impacting more and more every day, publishing house websites as well as in the social networks – leading them to create new strategies to engage consumers (especially online ones).
When Scott McDonald first addressed cross-media consumption in WRRS Berlin [19] publishers were making little effort to make the online content attractive and engaging to readers. The question that was raised back then was how to create subscribing models for the online content.
As media has evolved since WRRS Berlin, quantifying such a complex world using traditional research has became much more difficult – but is still the most driven way to gather detailed information about consumption habits and attitudes. The issue gets even more challenging when the content is segmented, which means, too many magazines titles, multiple sections, columns, blogs, all stimulated by electronic facilities, limited to paper and ink in the past.
Media researches must create ways of measuring this segmented and detailed information without losing track of the macro- context. This means: understand the combination of the media consumption market as a whole and the long tail theory [20]. In Brazil, Editora Abril is facing this reality, which is going to be discussed in this paper.
The subject of the present study, print media, has got quantification restrictions because of the great number of titles available. Moreover, this yields public (and, in the end of the day, content) segmentation.
Reaching the qualified target to apply traditional research has become a complex task, in particular in the developing economies, where interviewees are very concerned about safety and privacy issues (especially among the social segments with higher purchasing power).
Even when these obstacles are overcome, a much more complex question emerges: how can one manage to ask about hundreds of magazine and newspaper titles in the limited interview duration? Actually, quantifying the entire publishing market is very complex, not to say impossible, to be accomplished in a traditional face to face interview.
On the other hand, concerning the measurement of magazines and newspapers over the Internet, there are measurements processes that are entirely tech based and can be easily addressed. Some of these processes do not interfere in the web experience such as tags [1, 2, 3], which can detects with precision the number of people who visit a certain site. Ad servers [4, 5], for instance, manage to estimate the click rate on the served advertisements.
Online research using Internet panels are very helpful tools to assist research processes. The constant expansion of the web allows research institutes to carry out short-duration research studies that can reach hundreds (if not thousands) of people with lower costs when compared to traditional research methods. Besides, they are very precise [6, 21, 22].
Other types of research studies can contribute enormously to the understanding of determined consumption profiles. A good example is research on social networks using specialized software that visits people and communities and analyzes their relations [7, 23]. Processes such as those, enable us to gather a large amount of data, offering access to information in different segments. However, such information is hardly ever statistically representative. Most of the time there is no deep/extensive information for all individuals, since social networks are repositories in which information is not structured.
In addition to those technologies, some automated segmentation techniques are being developed aiming to assist the processes of ad delivery focused on determined targets. However, such type of technology still faces rejection because of controversies regarding privacy, since it gathers personal information on the web, in fact, a research [8] shows that 57% of people are not comfortable with advertisers using that browsing history to serve relevant ads, even when that information cannot be tied to their names or any other personal information.
Taking into account the various ways of gathering information supplied by traditional offline research studies, as well as by the new online methods, some models, such as statistical matching [9, 10, 11] can be used to create new databases from different types of research. The objective of data merging is to get better results in studies that have some similarities in the demographic and/or behavior profile as well as compatible universes.
The present paper is going to introduce an example of research data integration based on statistical matching. In order to do that, we defined a set of rules to be used and followed in the process to allow the generation of the merged data. The application of those techniques will lead to the same proportion of basic demographic variation (social segment, gender, age) over the researches. Also, it will be possible to build universe estimations, using the traditional research, as the basis for analysis.
This model is innovative: the use a sub-sample of an offline single-source research as the universe for an online (non representative) research study. This can be better seen in image 1. The objective of our exercise is to use the same procedure in other sub-samples that can be combined with numerous online research studies. The case presented here is quite similar to the Touchpoints project [12], a consumer-centric holistic measurement.
The case of Veja magazine, online readers are defined as a random sub-sample of the population that consumes online media – defined by quotas. The full sample represents the overall universe surveyed independently of Internet access or even computer ownership. That sub-sample may vary from one research to another, to handle this question we used 2 waves to guarantee a more precise subset of information.
We admitted that the total consumption proportions generated by the offline, single-source research are defined as the universe estimative for the theme that is going to be merged. For example, in this offline study, we observed that the average consumption of a segmented magazine website was 980 thousand individuals a month. In this way, when we carry out an extensive online research study on that website, we know that the expected size of the universe has about 980 thousand individuals – regardless of the number of interviews that were conducted.
Summing up, the objective of this paper is to define a practical model of data integration. As an example, we’ll demonstrate the process of merging between the Target Group Index [13] and an online research study on the Site Qualification Research of Editora Abril.
The Target Index Group is an extensive, single-source research study on habits, attitudes and consumption that is carried out twice a year, in two waves that sums up to 19 thousand interviews. The Site Qualification Research is done internally by Editora Abril and gathers the opinions and attitudes of the readers of 17 of its main sites – those that are connected to the main magazine titles of the publishing house. Using this annual research study, Abril gets to know its online public in a better way, as well as the changes and evolution of this target public.
Target Group Index supplies us extensive data on media and goods consumption, habits and attitudes of the Brazilian consumers. However, there is no basis for a deeper analysis amongst magazine titles, for example, since there are a few dozen cases of interviews for each magazine title.
But with the research study that was carried out by Editora Abril we count on a deep understanding of the reading habits of more than 1,400 online readers of a certain magazine. The integration between the Target Group Index data with the ad-hoc Site Qualification Research done by Editora Abril allows us to understand and contextualize habits, attitudes and consumption patterns of Editora Abril’s online readers (see Image 1).
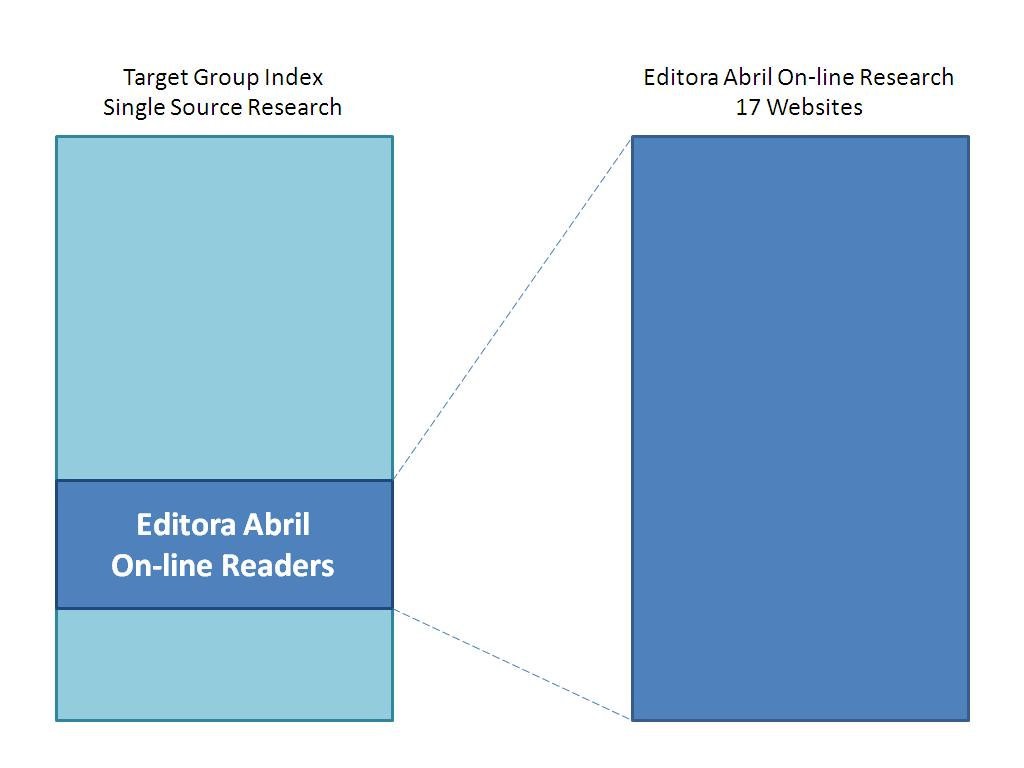
Image 1
More than searching for a definitive fusion format – something that has been exhaustively discussed in papers on the previous WRRS and Marketing Research conferences – this paper aims at merging information from research studies done in different environments (online and offline), but with complementary objectives, so that it becomes possible to make use of the benefits provided by each type of research and also by the fusion process.
– The Online Site Qualification Research study by Editora Abril
The online research study utilized here was carried out in the second half of 2008, by Editora Abril in 17 segmented websites of magazines that they market. The gathered information is related to demographic, psychographic and behavioral data, individual’s relation with the Internet in general, online purchases and interaction with the online ads.
We also aimed at understanding the juxtaposition between the online and printed consumption. With the data that was gathered, it was possible to understand consumers of the online magazine content as well as those readers of the printed magazines who also access online content. In order to guarantee the segmentation by title, a screening question was asked at the beginning of each questionnaire, ensuring that the respondents’ universe represents the totality of the readers of the magazine in the researched environment. Below, in image 2, one may see Veja magazine’s website.
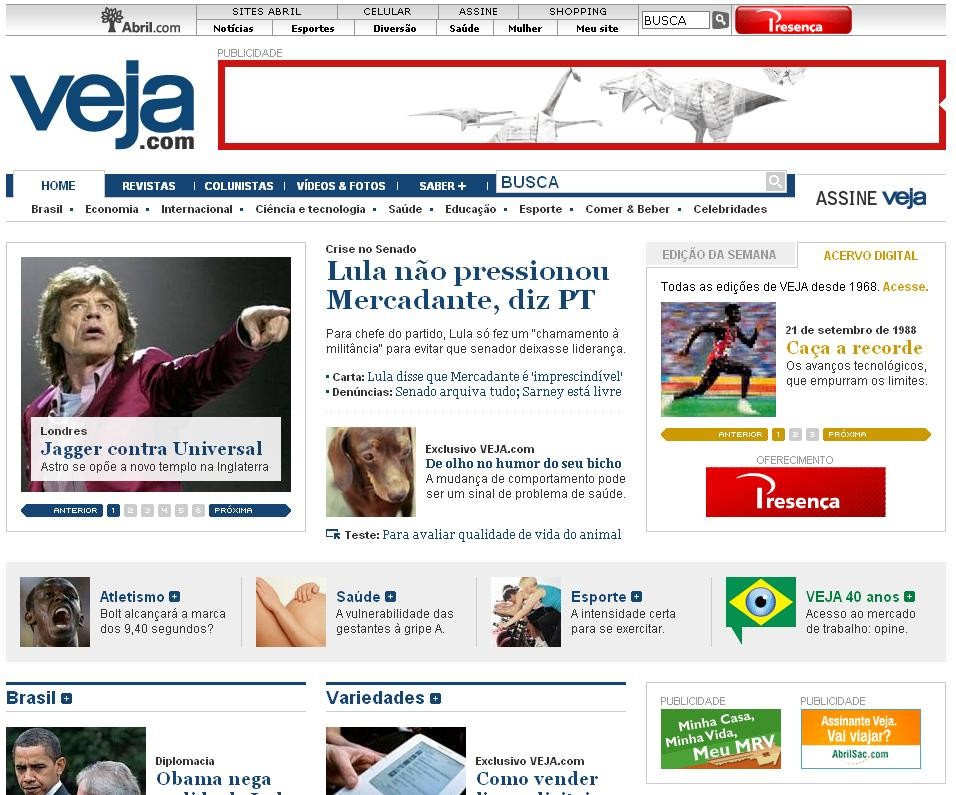
Image 2
In the past years, consumption of print media has declined across most traditional media outlets. On average, adults 18-49 read 4 newspapers less than they did 10 years ago. However, they read roughly the same number of magazines per month (…) Adults with Internet access (around 1/3 of the U.S. population) consume media differently from the general population. First and foremost, these individuals consume more printed media than the average consumer [20]. This is the reason why we have to keep studying the printed segment, even from the online perspective.
Obviously, it’s not possible to have a group of readers exclusive to the printed magazines (offline) in this research – since the recruitment of interviewees takes place only on the websites of the magazine. It is only possible to get information about offline exclusive readers using offline research method.
A few measures have been taken in order to assure the online research quality, amongst them: duplicated respondents have been deleted by crossing IP (Internet Protocol) addresses and personal information. Since companies usually have only one IP address for all employees, a maximum of 5 questionnaires were allowed to be filled out per IP, avoiding the same person to respond the same interview – which would introduce bias to research.
As in Brazil, the IPs are not permanent (especially in households), thus we also used the installation of cookies on the computers of the respondents. The Internet users who already had the cookies related to this research installed on their computers were prevented from responding to the research for the second time. However, a rate of 31 percent of cookie deletion was taken into account – this rate was defined by a study conducted by comScore [14].
Another important aspect: only the completely answered questionnaires were taken into consideration. Consequently, some processes that are used in research, such as answering questions based on similar profiles, or even tabbing questionnaires that hadn’t been finished, were eliminated.
The online respondents didn’t get any type of gratification for collaborating with the research. All the answers were result of spontaneous interest, avoiding the so called “professional respondents” (people who will answer any type of research with the objective of getting money or benefits). The Site Qualification Research followed the code of conduct by ESOMAR [15] for online researches.
There were over a thousand answered questionnaires for each of the 17 researched sites, which ensured representation of the sample and diminish the myth of the vulnerability of this form of researching and gathering information. During the research fieldwork period, the research focused in collecting quantitative data about the access to a determined magazine portal (audience), which enables the expansion of the research data into absolute values. The audience data that were gathered were: page views and unique audience.
In this research study, the use of quotas for demographic profiles was not taken into account. However, all data required for demographic qualification by gender, age and income has been collected, and they will be properly adjusted further ahead.
2.1 – Website that was selected for the study
Three website profiles that are segmented in the portfolio of Editora Abril (www.abril.com.br) had been primarily selected for the study. Those are websites of magazines that have the print version as well. In all cases, most of the online content is different from the offline content.
The weekly magazine Veja, with a weekly circulation of 1.1 million copies focuses its content on a comprehensive public estimated at 8.8 million individuals (TGI, Brazil 2008). Veja is the number one weekly information magazine in South America and it’s the third in the world. Its website has an average of 15.2 million Page Views and 1.4 million Unique Visitors per month [17].
On the other hand, Claudia magazine, a monthly publication that is segmented for the female public, has an average circulation of 404 thousand copies per month. It has 2.4 million readers (TGI Brazil 2008). Its website has an average of 4.2 million Page Views and 381 thousand Unique Visitors per month [17].
Quatro Rodas magazine has a male profile and an average circulation of 190 thousand copies per month [16] and has 2 million readers (TGI 2008). Its internet site has an average of 4.3 million Page Views and 764 thousand Unique Visitors per month [17].
The following analysis, as well as the examples of online and offline research fusion, were based only on data gathered with the online readers of Veja magazine. On the other hand, Claudia and Quatro Rodas websites were surveyed as well, but for time restriction reasons, results featured in the present study are only related to the Veja magazine website.
– Offline research – Target Group Index
Target Group Index is a global research study created in England in the end of the 1960’s. It meticulously quantifies the habits and attitudes of the targeted population. In Brazil, the research is conducted on a 100% probability sample (proportional to the population ranging from 12 to 64 years old), twice a year and amounts up to 19 thousand interviews per year. The research is conducted in the 10 main economic centers of the country, which together represent 63% of the Gross Domestic Product and is in its tenth edition.
It is a single-source research study that is split into two stages: in the first stage, the interviewer administers a face-to-face questionnaire, asking questions on socio-demographic variables and media consumption. In this stage, about 600 vehicles of communication are monitored – including online media.
Once this phase is finished, the interviewer hands in a questionnaire to the respondent in which he has to fill in options related to consumption, habits and attitudes on his own. More than 2,800 brands and 50 demographic variations are monitored. Also, 220 attitudinal sentences are presented to measure the level of acceptance.
All this information makes the product attractive due to the abundance of information and turns it into a hub candidate for fused data considering other research studies. In the present study, the Target Index Group will act as an evaluation parameter for the online research and as the provider of information for the online Site Qualification research study by Editora Abril. On one hand, there’s an abundance of information using well defined sample, on the other hand, there’s extensive information collected on the Web, but without taking into consideration any sampling control.
– A simple comparison between both studies
The first step taken to start the comparison between both research studies, in a general way, was the identification of the main similarities and differences between them – taking into consideration each investigation environment.
As there are no defined quotas, there is no minimum defined number of respondents for the online research study. Therefore, in order to estimate the volume (that is, the expansion of the universe) we computed an average number – considering the total Page Views of the site, which was collected from another research study [17]. Then each response will represent in average the total audience (unique page views) by the number of responses.
Later on, data weighted by quotas defined by the Target Group Index will be presented with the objective of evaluating the effect of the weighting. As explained before, the online survey will be weighted by offline universe figures. The following charts portray a simple comparison of the main demographic distributions of the offline research study (representative in the population) and its corresponding figures on the online research study. The data refers to Veja magazine.
| AGE | ||
| CLASS | % ON LINE | % OFF LINE |
| 10-14 | 0.3% | 2.2% |
| 15-19 | 3.2% | 7.2% |
| 20-24 | 9.6% | 22.7% |
| 25-29 | 11.0% | 20.9% |
| 30-34 | 11.3% | 8.4% |
| 35-39 | 10.3% | 9.9% |
| 40-44 | 11.3% | 9.8% |
| 45-49 | 11.9% | 8.7% |
| 50-54 | 13.3% | 5.5% |
| 55-59 | 9.8% | 2.4% |
| 60 + | 8.0% | 2.3% |
| TOTAL | 100.0% | 100.0% |
Table 1.a
Tables 1.b and 1.c show the distribution between both studies. The variable gender presents a bit larger difference because of a larger participation of male public in the online data collection. These differences will be corrected using a weight system to follow same TGI distribution figures.
| GENDER | ||
| CLASS | % ON LINE | % OFFLINE |
| FEMALE | 39.1% | 45.2% |
| MALE | 60.9% | 54.8% |
| TOTAL | 100.0% | 100.0% |
Table 1.b
| SOCIO ECONOMICAL CLASS | ||
| CLASS | % ON LINE | % OFFLINE |
| AB | 80.7% | 73.4% |
| C | 18.1% | 21.4% |
| DE | 1.1% | 5.2% |
| TOTAL | 100.0% | 100.0% |
Table 1.c
Through the comparison of the distribution by age range (See Table 1.a), it’s possible to notice an important difference. In the online research study, the answers are equally distributed among all age ranges above 20 years old. In the offline research study, on the other hand, we notice a substantial concentration between the ages of 20 and 29 and a similar distribution for the online research study only from the 30 to 49 year old age range. In the population that is over 55, the difference is very sharp as well. In both cases, we are only considering individuals who have Internet access and are Veja magazine website’s readers.
| DISTRIBUTION WEB + OFFLINE (000) | ||
| CLASS | ON LINE | OFFLINE |
| WEB SITE | 720 | 637 |
| BOTH | 269 | 343 |
| ONLY PRINT | – | 7,499 |
| TOTAL | 989 | 8,479 |
Table 2
Table 2 shows very similar numbers for offline and online readers, as well as of their total. The sum of “Web Site” and “Both” types of readers of the offline research study shows a quantitative result that is quite similar to the online one. The difference of only 9 thousand individuals (989 for the online and 980 for the offline) will be corrected with the use of individual weighting.
As said before, it’s not possible to estimate the number of exclusive readers of the printed magazine in the online research study since the questionnaire was inevitably applied on the website of the magazine.
To get to the absolute figures mentioned above, a tag measurement was applied to Veja magazine’s website. Therefore, it was possible to estimate the average number of Unique Users in the period during which the research was done. The total amount of sole individuals here is 989 thousand, calculated from a starting number of about 1.4 million. Those 989 thousand individuals were estimated by using the cookies deletion factor of 31%, achieved in market studies [14].
In the offline study, the “WebSite” line is related to individuals who said that their access to the content of Veja magazine is made only on the Web and/or mainly on the Web, putting the print magazine on the back burner. In the online research study this concept is applied to the respondents that mention they access the site and didn’t read the printed magazine.
To avoid this misunderstanding, it is recommended for further studies an alignment before fieldwork, creating questions that will lead to the same understanding and, consequently, the same answers.
– Process of Data Integration
– First step: Normalize online research figures.
After using the already mentioned filters (cookies deletion, removal of incomplete answers, among others) there was a total of 1,394 respondents on the online magazine, which is represented by 989 thousand weighted individuals, or Receptive Individuals
– an expression that will be used to refer to them from now on. In the offline research study, 389 individuals read the Veja magazine website, which represented 980 thousand individuals after the application of the universe expansion considering demographic quotas.
This number of 980 thousand individuals was used to calibrate the online research study and aims at making the fusion process more precise. This obliges both databases to work with the same universe number, both the receptor and the donator, so that every single individual is matched. This process is called constrained matching and has already been mentioned in statistical studies [9, 10].
A marginal weighting was carried out using demographic variables (gender, age range and social economical class), with the objective of correcting the distortion in the quotas, using the offline research study distribution for the same cluster of readers, corresponding to 389 individuals.
At this moment, the main concern is not to correct the quotas according to a certain region or social class, but to match it to a specific segment defined by the offline research study, i.e. Target Group Index.
In Table 3, it’s possible to see the results of those weights of the online research study before and after weighting. Note, other distributions were considered for the variable “Age”. One may see that the distribution was perfect as well as the projection of the absolute values, as they have equal totals (980 thousand individuals). In this way, we can proceed to the fusion since the universes of the online and offline research studies are entirely compatible. Keeping the universes coherent, leads to a near 100% individual matching.
| WEIGHTS | |||
| % ON LINE | % ON LINE | % OFFLINE | |
| CLASS | RAW | WEIGHTED | WEIGHTED |
| AB | 80.7% | 73.4% | 73.4% |
| C | 18.1% | 21.4% | 21.4% |
| DE | 1.1% | 5.2% | 5.2% |
| FEMALE | 39.1% | 45.2% | 45.2% |
| MALE | 60.9% | 54.8% | 54.8% |
| 12-19 | 3.4% | 9.4% | 9.4% |
| 20-24 | 9.6% | 22.7% | 22.7% |
| 25-34 | 22.3% | 29.3% | 29.3% |
| 35-44 | 21.6% | 19.7% | 19.7% |
| 45-54 | 25.2% | 14.2% | 14.2% |
| 55-64 | 17.9% | 4.7% | 4.7% |
Table 3
The distribution presented in Table 3 by age range is different from the ranges that have been presented in Table 1.a. To pursue a quasi perfect matching, they should be compatible with the ranges defined by the Target Group Index, our offline research. This correction was necessary for applying the weights and, consequently, for having a better performance in the fusion process. Of course we can use open ages avoiding ranges, but it wasn’t possible since the online research collected ages grouped from ten to ten years.
The online research considered all the individuals older than 60 years old as the last age range (60+), whereas the offline research considers 64 years old as the final limit. Such a diversion, as it has been previously mentioned, was using weighting.
It is possible to notice that there was not, a priori, a defined set of variables and their frequency values for both research studies before they had been carried out. This makes the following processes much more complex and with a higher margin of error. Naturally, it is extremely important to align the research studies before performing the fieldwork, not only with the same variables, but also by the very questions to be asked. If they are too different from each other, they can lead to very different results, invalidating the whole process.
In the present paper, we verified that if a few questions had been asked in a different way, we would have had more hook variables and this would certainly have lead to a better fusion performance in regards to quality. So, if there is the need to fuse two researches, it is very important that the questions in both of them are similar.
– Second step: apply the data fusion
After aligning the demographic variables and making them proportional using weights, the data fusion was carried out between the online and offline research studies. As mentioned before, the online research study was defined as the data receptor only because it had a larger number of cases, whereas the offline research study was defined as the donor. With a larger number of cases, the receptor base receives most of the information from one single donor, as their total universes are compatible. We verified, in this case, that the average weight of each donor was 3.58 times higher than the weight of the receptor. This means that each donor will donate information on average to at least 3 receptors.
There are many algorithms for data fusion. In the present paper, we decided to use a very simple method, because we didn’t expect to focus on the problem of fusion at the moment. Nevertheless it’s hard to apply fusion without writing a few paragraphs about the process. The model used here has the following aspects:
-
-
- The hook variables used in the fusion are only demographical (social economical class, gender and age range). We know that behavioral variables can yield better results as they can aggregate people that have similar consumption behaviors. They weren’t used mainly because of questionnaire alignments, as they were created in different companies without previous knowledge.
- All the hook variables are normalized for values between 0 and 1, making the distance calculation simpler.
- The distance between a receptor and a candidate is measured by the sum of the distances between each normalized hook variable. This means that the larger the distance, the larger the difference between one receptor and one donator. We decided not to apply weights to each variable which can be used to give some privileges. For example we could give weight 2.0 to a social economical class to give more importance to that variable in the distance equation.
- Considering normalized values between 0.1 and 3 hook variables, the largest distance will be 3 and the smallest will be 0. Smallest means individuals are equal considering demographics.
- When a candidate (donator) is chosen, his data is copied to the receptor and its weight is deducted from the weight that is given to the receptor. This donor will keep donating information up to the time that its weight is equal to zero.
- If a receptor gets data from more than one donor, the data from the first donor (the one that technically has a higher weight) is going to be the valid information for this receptor.
-
– Algorithm Performance Analysis
The performance of the entire fusion process does not take more than 1 minute to run, in this way, any concern with the processing or with the measurement of performance is considered unnecessary and irrelevant.
– Selected Variables for the Study
– Online Research study
For the fusion process of the online research study and the TGI database the following variables were taken into account: demographics, access location, services used on the web, information concerning the Internet Veja usage, purchasing activities on the web and the relation that the user has with the internet ads.
It is particularly important to verify if these variables were affected after the fusion, as shown in Table 4. In this way, it’s necessary to check if they are still consistent with the original research study, even being in a new database. In order to do that, we chose a variable from each group that was selected in the online research immediately after the weight process.
| VARIABLES AFTER FUSION PROCESS | |||
| VARIABLE | # ON LINE | # FUSED | DIFF% |
| ACCESS FROM WORK | 578,884 | 578,827 | 0.01% |
| USE ECOMMERCE | 515,305 | 515,268 | 0.01% |
| USE INTERNET BANK | 487,292 | 487,256 | 0.01% |
| READ VEJA.COM DAILY | 288,293 | 288,263 | 0.01% |
| READ VEJA.COM WEEKLY | 389,220 | 389,199 | 0.01% |
| READ VEJA.COM MONTHLY | 215,527 | 215,505 | 0.01% |
| READ VEJA.COM COLUMN. | 382,826 | 382,794 | 0.01% |
| BUY GAMES – ECOMMERCE | 131,048 | 131,036 | 0.01% |
| BANNER ACTION NEVER | 483,951 | 483,906 | 0.01% |
| BANNER ACTION SOMETIMES | 486,717 | 486,683 | 0.01% |
| BANNER ACTION ALWAYS | 9,250 | 9,248 | 0.03% |
Table 4
In Table 4, it is possible to see that the difference between the variables before and after the fusion is insignificant, not compromising the analysis of the merged data. This difference is irrelevant because the receptor base didn’t suffer any weight or information adjustments from its own information. The differences, in this case, are attributed to the possible differences between the universes of both research studies, even after the weight process.
Again, it’s important to stress out that we don’t intend to perform an extensive analysis of the models of data fusion. We want to use a simple and efficient model that is able to support the entire process of analysis of the research data that was collected in different ways.
– Offline Research study
For the offline research study, besides the demographic variables used in the fusion process, three other classes of variables were employed (out of more than 200 available). We decided to use for each individual; the car brand, the bank in which they have account and the brand of coffee that they consume. Such variables are comprised in three large categories, which are Auto, Financial and Products and are related to the Brazilian consumer market.
The comparative analysis, in this case, was carried out using the Choices software from KMR [24], a platform that is marketed to analyze the Target Group Index research data. Table 5, below, shows a few comparisons related to the three product classes that had been defined above.
| VARIABLES AFTER FUSION PROCESS | |||
| VARIABLE | # OFF LINE | # FUSED | DIFF% |
| AUTO FIAT (TOTAL) | 202.940 | 205,518 | 1.27% |
| AUTO FORD (TOTAL) | 57,820 | 62,421 | 7.96% |
| AUTO VW (TOTAL) | 150,580 | 147,810 | (1.84%) |
| BANK ABN AMRO | 70,620 | 72,011 | 1.97% |
| BANK BRASIL | 288,740 | 282,378 | (2.20%) |
| BANK BRADESCO | 165,560 | 171,840 | 3.79% |
| BANK ITAU | 150,650 | 150,571 | (0.05%) |
| COFFEE 3 CORACOES | 38,270 | 39,284 | 2.65% |
| COFFEE IGUACU | 57,240 | 60,448 | 5.60% |
| COFFEE NESCAFE | 241,160 | 238,340 | (1.17%) |
Table 5
The differences now are more substantial, as we can see in the fourth column (difference in “%”). It shows the comparison between the absolute universes before and after the fusion for individuals that consume the brands and/or products. The difference is relatively small, but there are a few exceptions, such as having a car by Ford brand, which reaches 7.96%. We did not notice any connection between the number of cases and the size of the error.
Such differences may be credited to the difficulty of matching individuals that consume some mentioned brands, creating a few inconsistencies. For example: A certain receptor might receive 75% possession of a individual that has a Ford car and 25% of another owner of a Fiat car. Since the piece of information that had the higher weight was Ford, this person is, then, counted primary as a Ford consumer. This type of problem can be addressed by attributing probabilities in the fused database. This type of analysis was not performed and it might be the subject of future studies and improvements.
– Analysis of the Fusion Performance
At the end of the process, we created a log of all the matching between the variables; therefore we could perform a few analyses and forecast errors along the process.
The first set that was analyzed was the number of joins that a receptor did to complete the information. This can be seen in Table
6. Some people did not get any information, but they represent only 0.02% of the total – which probably is because there is a small absolute difference between the universes. Most of the individuals got information from one, at most, two individuals and this represents 94.21% of the total. The average number of joins in the study was 1.27, that is, one receptor got information from about 1.27 donors.
| NUMBER OF JOINS PER INDIVIDUAL | |
| JOINS | % OF TOTAL |
| 0 | 0.02% |
| 1 | 67.82% |
| 2 | 26.39% |
| 3 | 5.25% |
| 4 | 0.52% |
Table 6
In Table 7, it is possible to analyze an error generated by imperfect matching. We verified that 75% of the matching cases were absolutely perfect (considering three variables), in other words, the distance calculated between the receptor and the donor was zero. In 10% of the cases, there is an average matching error of about 26%. This type of analysis demonstrates the quality of the matching. In a deeper investigation, it would be possible to identify the imperfect matches and to attribute a quality index (score) to them that would influence the final analysis of the data collected.
| MATCHING PERFORMANCE – FREQUENCY | ||
| FROM | TO | ERROR |
| 0 | 10 | 0.00% |
| 11 | 20 | 0.00% |
| 21 | 30 | 0.00% |
| 31 | 40 | 0.00% |
| 41 | 50 | 0.00% |
| 51 | 60 | 0.00% |
| 61 | 70 | 0.00% |
| 71 | 80 | 0.57% |
| 81 | 90 | 4.72% |
| 91 | 100 | 26.21% |
Table 7
The errors are more frequent in DE Classes (lower income classes) because of the low number of interviews collected by the Site Qualification research – only 16 from a total of 1,394. This makes the matching process more difficult – taking into account the three variables (Class, Gender and Age).
– Final Analysis
The fused database gives hundreds of data crossing possibilities. To illustrate a few, we have done comparisons with the three groups of products merged from the offline research study. The idea here is just to give a hint of what is possible to develop in the new study. With these data in hands, publishers and advertisers may define and reach – in a much more precise way – their target.
In here we do not aim to analyze deeply the data, neither is our objective to propose actions for each of the brands and products which appeared in the results. Our idea is to display some possibilities of analysis and its applicability.
The first group of data analyzed is related to car brands. The objective here is to analyze who are Veja online readers who own cars and what is their attitude over a sponsored link.
Table 8 portrays that the behavior connected to the action over sponsored links can vary from car brand to car brand – and even amongst models. The Fiat brand has the highest percentage of not clicking on sponsored links: 29.5%; whereas the individuals that have a Palio car model (from Fiat, young style) are more likely to click on it.
Ford brand consumers are those who come in first in always clicking on a sponsored link. In this analysis, car brands came from TGI while click action from online research.
| ACTION OVER A SPONSORED LINK | ||||||
| ACTION | CHEVR. | FORD | FIAT | FIAT PALIO | PEUGEOT | VW |
| NEVER | 25.8% | 28.5% | 29.5% | 26.0% | 27.8% | 32.6% |
| SOMETIMES | 44.1% | 37.8% | 41.4% | 49.4% | 48.3% | 42.9% |
| ALWAYS | 30.1% | 33.7% | 29.1% | 24.5% | 23.9% | 24.5% |
Table 8
This kind of information may lead the advertiser to a better ROI (Return Over Investment) –some brands have excellent results with some ad investments, others must search alternative ways of advertising.
An interesting analysis is to cross e-commerce usage with consuming of determined products. In Table 9, it’s possible to see this analysis amongst Veja online readers and Brazilian coffee brands consumption declared in Target Group Index research. It’s possible to notice that there are substantial differences in behavior according to the consumption each coffee brand. Maybe this is because the study is performed within a social economic class that has a higher income and that has more access to broadband internet access and consequently more adherence to e-commerce websites.
Almost 75% of the online researched individuals belong to AB class (higher income and consumption levels), as can be seen in Table 3 – and there is a very positive relation between this social class and e-commerce usage. Only 14% of the individuals that belong to AB class say they never bought using e-commerce. It’s important to keep in mind we are always focusing on Veja online readers for all analysis. Table 9 shows that the brand Pilão has an important relation to e-commerce usage (95% considering sometimes and frequently).
This type of analysis shows a few possibilities for certain brands to better explore their sale potential on the internet – and also how to use their advertising budget. Combining the user’s response seen in Table 8 with a preference for a certain brand, that is, the result on Table 9 would bring yet other interesting results.
| EXPERIENCE BUYING PRODUCTS VIA E-COMMERCE | |||||
| BUYING | NESCAFE | IGUACU | 3 CORACOES | PILAO | MELITTA |
| NEVER | 17.0% | 17.4% | 21.1% | 5.1% | 12.3% |
| SOMETIMES | 36.4% | 43.1% | 49.0% | 50.6% | 46.0% |
| FREQUENTLY | 46.6% | 39.6% | 29.8% | 44.3% | 41.6% |
Table 9
To complete the results, we compared the behavior of individuals who have current accounts in certain banks and use Internet Banking. We also crossed this information with their experience in social networks. This analysis demonstrated that there are great opportunities for banks to boost their Internet Banking users optimizing their advertising resources.
Besides, an effort must be made to observe the behavior of the clients on social networks – something that has been gaining importance in the past few years, mainly because of the readiness of access, exposure (personal and ideas) and organization (social). It’s very usual to see people discussing their experience associated to certain brands in specific communities of certain social networks.
Table 10 shows those who use Internet Banking and who are Veja readers. The information on the banks came from the offline research study, whereas the number of people who use Internet Banking came from the online study. It’s important to notice that for most of the banks not even half of the clients use Internet Banking. However, for Caixa Econômica, this rate is over 58%.
This type on information is useful for evaluating the engagement opportunities in ads for segmented publics on the website or even in association with the offline campaigns. In a simple comparison, we noticed that 14% of the website users say that they use Internet Banking and that they also read the print magazine.
| INTERNET BANKING USERS BY BANK | |||||
| USE | BRADESCO | CAIXA | ITAU | BRASIL | ABN AMRO |
| NO | 49.7% | 42.0% | 44.6% | 50.3% | 47.9% |
| YES | 50.3% | 58.0% | 55.4% | 49.7% | 52.1% |
Table 10
In the last Table, 11, we portray the relation of the banks with the social networks. We saw that having an account in a bank and using Internet Banking is something different from having an account in the same bank and using social networks, and this can lead to a few demands of brand monitoring. Notice that banks Bradesco, Brasil and Caixa have larger representations in social network access than in Internet Banking usage, whereas Itaú and Abn Amro have similar participation in both of them.
| EXPERIENCE USING SOCIAL NETWORK | |||||
| USE | BRADESCO | CAIXA | ITAU | BRASIL | ABN AMRO |
| NO | 37.1% | 33.7% | 47.4% | 41.9% | 46.9% |
| YES | 62.9% | 66.3% | 52.6% | 58.1% | 53.1% |
Table 11
If we analyze this from a different point of view, we see that the social networks pose good opportunities to the enhancement of all banks images and relation with final consumer. Bradesco and Brasil have a bigger opportunity here, since their share is bigger than the average.
– Conclusion
The use of a single-source offline research can be a good way to define sub-samples for a fusion study, considering online and offline worlds. This may be applied in particular to print media to evaluate the behavior and migration of offline readers to online as well as their relations.
The use of the fusion model introduces enormous opportunities for new businesses in research institutes as well as for segmented websites. New forms of analysis can be generated through data fusion processes using online research studies and single-source tools, such as the Target Group Index.
We verified that the normalization of the research studies in regards to the questions and to the answers is somewhat fundamental. Therefore, if there is a previous and detailed brief of the research objectives, we are able to create better and stronger hook variables which may provide an even safer data fusion, considering not only demographic variables as well as behavioral.
Using weighting processes allied to fusion systems – that have enough intelligence to automatically decide which variables must be used as hooks – is something necessary to generate productivity in database creation. This lowers the costs with data preparation. Observing this scenario we dedicated part of the research time to develop automated processes aiming to better quality and velocity.
Performance evaluation is also something very important. It provides groundings for the analysis software informing, for example, what are the qualities of each individual in the process.
All this allows publishers and brands to evaluate the best advertising combinations to reach their consumers – not only traditional advertisement, but also how to position a brand in a social network, for instance.
– Future Research Studies
We are thinking of improving the following aspects in future studies:
- Defining a standard file format for the questionnaires exchange, for example, an XML format. This will improve the process as today we have to deal with different file formats.
- Creating a dictionary of questions and answers in order to obtain more normalized variables. This will improve fusion performance as we have already said before.
- Creating new data fusion algorithms and evaluating their performances. The idea is to use these algorithms as a system parameter, or even the system can run different algorithms and choose the best one considering output results.
- Creating a probability model to deal with imperfect matching. This probability information could be interpreted automatically by client system during analysis evaluations as well scores acting as alerts.
- Creating an environment to analyze primary results. It’s important since to take these results to some client software bring some unnecessary efforts.
- Creating a user interface to analyze data to be fused. It’s important to understand the distributions and frequency for each variable before being assigned to be a hook. For example, the male gender in one certain database may represent 70% of individuals while another may represent only 30%.
– Acknowledgements
The authors would like to thank those who collaborated to prepare the research data and to organize additional information on the products that were analyzed, Claudia Villela and Henrique Simões, and for the proofreading, Celina Takemura.
– Bibliographical Information:
- Google-analytics, http://www.google.com/analytics, last accessed in September, 1st, 2009
- Omniture, http://www.omniture.com, last accessed in September, 1st, 2009
- Certifica, http://www.certifica.com, last accessed in September, 1st, 2009
- DoubleClick, http://www.doubleclick.com, last accessed in September, 1st , 2009.
- 24.7 Realmedia, http://www.247realmedia.com, last accessed in September, 1st, 2009
- Greenfield-Ciao, http://www.greenfield-ciaosurveys.com, last accessed in September, 1st, 2009
- Crivellaro A., Takemura C.; I sleep with my mobile – Consumer insights throughout Social Networks, ESOMAR Consumer Insights, Dubai, 2008.
- 2008 Study: Consumer Attitudes about Behavioral Targeting, Sponsored by TRUST eResearch independently conducted by TNS Global, March 28, 2008
- Radner, D.B., Allen, R., Gonzales, M. E., Jabine, T.B. and Muller, H.J. (1980), Report on Exact and Statistical Matching Tecniques, Statistical Policy Working, Paper 5, US Dept. of Commerce, Washington DC, US Government Printing Office.
- Willard L. Rodgers (1984), An evaluation of statistical matching, Journal of Business and Economic Statistics, 2-1, 91-102.
- Crivellaro A., Ferreira A. R. A, Building a Radio Panel Using Fusion and Recall Surveys, WAM 2002, ESOMAR, Canes, France.
- IPA TouchPoints Initiative, http://www.ipa.co.uk/Content/TouchPoints-Site-Home.
- Target Group Index BrY9w1+w2 (Ago07-Jul08) V1.0
- ABRAHAM, Magid, MEIERHOEFER, Cameron, LIPSMAN, Andrew; The impact of cookie deletion on the accuracy of site-server and ad-server metrics: an empirical comscore study; comScore, INC.
- Conducting Market And Opinion Research Using The Internet, http://www.esomar.org.
- Media IVC – Instituto Verificador de Circulacão, Brazil, http://www.circulacao.org.br/, 2009
- Certifica, Data Collection Using Tag, Average 2009 – January to June.
- Faase, John; The Virtual Currency, Worldwide Readership Research Symposium 2007, Session 10, Paper 58.
- McDonald, Scott; The challenge of interactive media to conventional print measurements models, Worldwide Readership Research Symposium 1995, Session 2 – Technology
- Deniz, Tonya and Kate Lynch, The case of the disappearing reader, print in the new media space, paper, Worldwide Readership Research Symposium, 1999, Session 10.1
- LightSpeed Consumer Panel, us.lightspeedpanel.com, last accessed in September, 1st, 2009
- NPD Online Research, http://npdor.com, last accessed in September, 1st, 2009
- Web Crawler Technology, http://en.wikipedia.org/wiki/Web_crawler, last accessed in September, 1st, 2009
- KMR Software – Choices, Version 2.6.2 November 15th, 2006.