Mainak Mazumdar, The Nielsen Company
Worldwide Readership Research Symposium Valencia 2009 Session 2.2
Introduction
Technology continues to be a change agent for the world of audience measurement. Alternative data sources such as adservers / webservers, set-top boxes (STB), and logs can supplement panel-based audience measurement and are rich sources for reporting media behavior. This research project focuses on the potential these digital footprints have for providing unique insights into media behavior and for helping to validate and confirm both strengths and limitations of panel-based audience measurement.
To a large extent, while media and advertising practitioners have embraced the technology-driven changes and found unique ways to buy/ sell and evaluate online media, the same cannot be said for the audience measurement industry. Researchers have been cautious and, at times, reluctant to fully combine the insights from these data into comprehensive audience measurement services. The complexity of data sources and massive volumes of server-side census data have posed interesting challenges for the researcher trained in small and well-controlled samples.
Nielsen researchers, working with these complex and large datasets for the last few years have designed a comprehensive data and analytical strategy for combining user-based panel and site-based census information for audience measurement. Due to its approach of utilizing the strengths of these various datasets, this methodology is commonly referred to as “hybrid.” The results of this research indicate that the best way of dealing with so-called “census-level” audience data is to commingle it with a controlled panel of consumers whose attributes Nielsen can measure with a high degree of certainty. This hybrid approach has been a great success in European markets and in the U.S. The reason is that while census-based data streams – the kind generated by TV digital set-top boxes, or by online Web sites and ad servers – represent a critical mass of the audience population, they are not as good as longitudinal metered panels at identifying individual people, their complete demographic profiles, or their media consumption behavior.
This paper discusses Nielsen’s “hybrid” analytical strategy and shares key findings relevant for online audience measurement.
The paper has three specific objectives:
- Summarize the strengths and limitations of census and panel data.
- Discuss three different analytical strategies in integrating Census and Panel data. The three approaches are, namely, “server mashup”, “site-centric scale down”, and “observed user-centric integration”. We recommend the user-centric observed method, as the approach retains the unique and crucial advances made in panel measurement as well as addressing media planning and buying requirements.
- Show that combining panel/ census information provides opportunities for the industry to answer questions that were elusive in the past and support the usage of this integrated approach for media measuring, planning, and buying communities.
Research Issues
There are advantages disadvantages to utilizing any single primary data source. A comprehensive and accurate approach must draw from and integrate several sources.
Data from Nielsen Mobile media surveys and the new mobile meter provide information on internet usage by cellular telephones and other mobile devices. Site-centric data from Nielsen SiteCensus provide guidance on the total volume of internet activity from non home and work locations, particularly on volumetric measures, on a site-by-site basis. Nielsen @Plan surveys offer a comparative view of behaviors on devices currently not directly measurable, such as archaic operating systems and newly emerging technologies. Cross-media measurement are accomplished by combining the data from the Nielsen People Meter for measuring television to show the relationship between and overlapping usage of the internet and TV.
The new hybrid methodology represents a synergy of the panel and tagging methodologies. Since the panel element of the hybrid methodology measures people and not computers, browsers, or devices, we are able to capture all websites in the universe without any requirement of effort from the site owners. We are able to drill down to granular respondent-level information such as demographic data in the reporting results. The tagging element of the hybrid methodology allows us to capture data from all locations where internet activity is occurring. User session and page impression data are comprehensive, so we can capture long tail niche usage just as easily as the largest website.
Methods
There are three ways that the integration of site-centric and user-centric measurements can be implemented. They are as follows:
- Side-by-side integration (“mashup”)
In this approach, when a similar metric exists in the panel and server services, the “best” metric from each service is decided and the client interface only displays the selected “best” metric. There is no true integration since a single report using data points from both site-centric and user-centric sources is created. This approach is simple and is one that various researchers and publishers are taking. However, the hybrid metrics may conflict with one another in terms of trending direction. Furthermore, there is almost no analytical capability to use the metrics in conjunction with one another, and any type of per person metric is also likely to be inaccurate. Examples of this methodology include the VideoCensus reports, where audience and duration metrics are derived from panel data and presentation metrics are derived from the site-centric data.
- Site-Centric integration (“scale down”)
This methodology uses census data as the source data. It is calibrated and scaled down using user-centric data from the panel. This approach is simple, but there is limited analytical capability to drill-down on the integrated metric. There is no respondentlevel information such as demographic data in the reporting results. Furthermore, no data are available from non-tagged sites and invalid, non-human traffic from spiders and bots cannot be correctly excluded. This methodology attempts to reduce a count of browsers or cookies to represent unique audience members. This “scale down” approach, where site-centric data are scaled down to the person level, is not usable for media planning since it represents a report on values and not individual people.
- User-Centric integration (“observed”)
This methodology uses user-centric data as the source data. It is calibrated using information derived from the site-centric data. This approach is less intuitive and requires a fairly complex initial design. However, its strengths outweigh the difficulty in execution. This methodology corrects for the weaknesses of both systems, enables reporting on all sites, and allows the fulldepth of analytics that are currently available from the panel data. This approach covers activity from all locations and settings, including those outside of home and work where individual metering is challenging or impossible. It therefore includes coverage of work usage in shared settings, secondary PCs at home, public access locations, mobile usage, and unmeasurable devices.
To address these objectives, we use data from Nielsen Online’s Audience Measurement services in the American, Australian, and European markets. Data from Nielsen’s metered NetView panels (probability and online sample) and SiteCensus product are used for combining the panel and census information, respectively.
One reason that no previous measurement systems has accomplished this is that measuring internet access from all locations is a formidable task. For public access locations such as cafes and libraries, a demographic profile of the user who installed the Meter can be collected, but the individual using the computer for a specific session cannot be definitively identified. As a result, it is difficult to obtain demographic information about all users.
In the example of measuring mobile access to the internet, a purely metered panel approach is limited due to constantly evolving technology. New mobile devices that allow new means to consume media, such as the Kindle, are emerging with great frequency. Gaining informed consent from users to track their activity is a major obstacle to overcome for mobile technology.
The first step in implementing the observed user-centric hybrid methodology is clearly identifying the universe of “Other” (nonHome and non-Work dedicated) location users and their demographic and behavioral profiles. Direct measurement is combined with other sources of Nielsen data to estimate the volume and type of “Other” locations activity. Available sources include high quality enumeration surveys based on area probability, address-based, and random-digit dialing sampling, detailed @Plan surveys, Nielsen Mobile Media surveys, SiteCensus, mobile device metering, and PC metering for “Other” locations. We then use discriminant and cluster analyses to developed the detailed “Other” location profiles.
Once the profiles were established, we analyze the home / work and other location metered samples to identify the panelists that match the other location profile (via fusion hooks). We then use statistical distance of mean (Mahalonabis distance) from the profile and donor to develop the matching algorithm. The matching algorithm is then applied to the metered sample to identify the panelists that look like other location profiles. Once we know how many people use the internet from these other locations and devices and have an idea of their online behavior in terms of duration and other factors, we can build out the other sample.
Similar to standard metered panels, we use weighting to ensure that the universe match as observed in the enumeration sources is correct. Home, work, and other duplication factors from the enumerations are then applied to measure overlapping usage across all locations. Finally, we conduct independent validation to ensure that the levels of online behavior are within the expected range. The “Other” location panel is thus a partly modeled and partly metered panel as it is extremely expensive to actually develop a meter, recruit, and maintain a comprehensive observed sample in all these other locations or devices.
Once we have built the “Other” location panel, the final step is to integrate this new panel with the home and work panels. We first select the panelists that we want to fuse, append the “Other” location data with home and work, and make the final adjustments to the reporting metrics using census tagging data for the volumetric measures where applicable.
Analysis
The design of the user-centric approach is guided by the construction of a third panel to go with the existing home and work panels. The third sample or the “Other” sample is defined as “all locations and settings currently not measured by the home and work panel”. For example, it includes:
- Work usage in shared settings
- Secondary PCs at home
- Public access locations
- Mobile usage
- Un-measurable devices
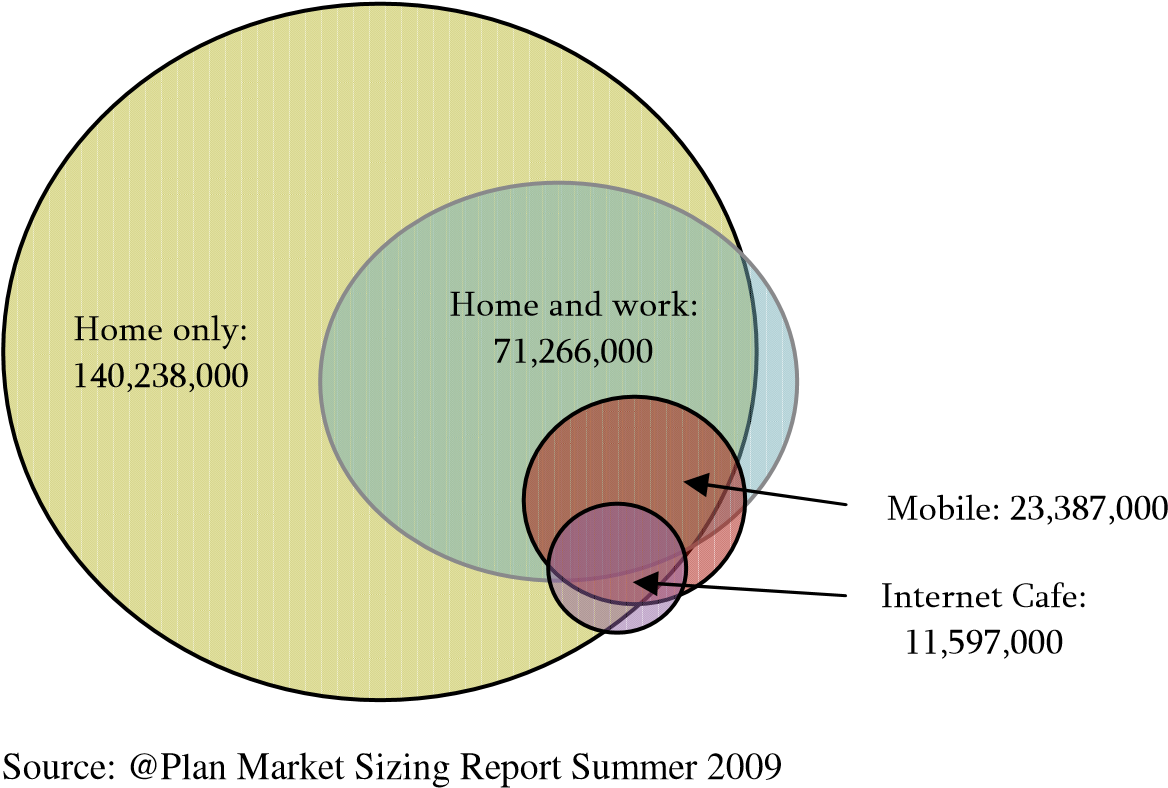
One estimate for internet access universe by location is as follows:
| Estimate of Access Universe by Location | ||
| Access location | market size | composition % |
| Access from home (any) | 140,238,000 | 95.00% |
| Access from work (any) | 75,949,000 | 51.40% |
| Access from both home and work | 71,266,000 | 48.30% |
| Access from hotel room/business center (any) | 27,214,000 | 18.40% |
| Access from Internet café/coffee shop (any) | 11,597,000 | 7.90% |
| Access from library (any) | 16,446,000 | 11.10% |
| Access from school (any) | 11,891,000 | 8.10% |
| Access from friend’s/family’s home (any) | 29,302,000 | 19.80% |
| Access from cellular phone/wireless device (any)
Source: @Plan Market Sizing Report Summer 2009 |
23,387,000 | 15.80% |
However, much of this is duplicated as people can access the internet through multiple locations. Our estimates are that around 46.7% of individuals access the internet solely from home, 3.2% of individuals access the internet solely from work, 48.3% of individuals access the internet from both home and work, and only 1.9% of individuals access the internet from a location other than home or work.
Furthermore, when we look at other reporting volumetric data, we can see that non-home and work access locations account for less than 4% of total page views, duration and sessions.
| Volumetric Data by Location | |||
| access location | share of hits | share of duration | share of sessions |
| Home | 49.09% | 54.25% | 52.64% |
| Work Dedicated | 47.36% | 42.49% | 43.88% |
| School | 1.23% | 1.30% | 1.08% |
| Other | 0.43% | 0.39% | 0.38% |
| Work Shared
Source: US RDD/Online data, April 2009 |
1.89% | 1.58% | 2.01% |
Consequently, non-home and work locations still account for a very small part of overall internet traffic.
Conclusions
Notwithstanding limitations of coverage, probability sampled and directly measured panels allow us to measure media behavior and metrics with great care, precision and certainty. These panels are significantly more accurate than server data in differentiating between media versus advertising viewed by user, user-requested media versus auto page refreshes or, calculation of metrics such as “time-spent.” Panel data alone can provide the ability to analyze the demographic characteristics of all users.
Expanding panel coverage via modeling (e.g. Fusion) and/ or metering beyond home and work internet consumption (e.g. mobile meter) are not only important steps in combining panel with server data, but are required for accurate results. Servers counts, although affected by non-human traffic (e.g. spiders), can provide accurate and more complete counts of page views, video streams and ads.
The integrated hybrid data deliver both audience information and advertising inventory used for online media buying and selling. Additionally, the measurement system provides the industry a comprehensive platform for advertising measurement, including post-buy analysis and online/ offline return on investment.
Next Steps
One of the major challenges is how to quantify the volume of SiteCensus hits/streams that are from bots, from different browsers, and from multiple PC usage, etc. This method allow us to do so, as can be seen in the example below of the reconciliation between the unique viewers and unique cookies for a website.
| Video Site X, Unique Viewers- April 2009
Total Unique Viewers (VideoCensus reported) |
6,458,000 |
| Plus: Distribution Partner Duplication | 941,883 |
| Plus: home/work duplication | 1,689,920 |
| Plus: Non Home/Work Usage | 596,640 |
| Plus: other location duplication | 6,761,360 |
| Plus: Machine/Bot Traffic | 2,091,038 |
| Plus: Advertising Only/Bumper Only Viewers | 101,870 |
| Plus: Different computers | 3,116,816 |
| Less: Computers shared | 447,480 |
| Plus: International usage | 143,908 |
| Multiple browsers | 509,350 |
| Total Uniques (Site X Cookies) | 19,400,379 |
The observed hybrid method expands panel coverage beyond the home and work universes and includes the volumetric insights of server data to cover new locations including mobile phone usage and public access locations. Once implemented to one expanded set of locations – home, work, mobile, and public access – the technique is readily expanded further to new locations such as school, work shared, group quarters, out-of-home guest usage, etc.
Despite the complexity of this hybrid methodology, Nielsen has the unique capability to build this system and is currently expanding it. New data sources coming on line now are a Meter for mobile phones and other devices; an improved universe estimation system shifting from random-digit dialing to address-based sampling and area probability; and full integration of PC data with TV and Mobile, including fusion of metered datasets. We already directly collect data on US metered panelists at School (nearly 2,000 active panelists), Public Access (about 1,000), and Work Shared (about 1,700) locations and also collecting data from guests visiting other households (about 1.17% of all user sessions) and from other users simultaneously access the computer for specific applications.