Worldwide Readership Research Symposium Valencia 2009 Session 2.3
Marion Appel, Intomart GfK
Enrico Verhulst, Nedstat Frans Kok, JIC STIR
1 Introduction
In 2004, a group of Internet providers in the Netherlands undertook to commission a new study for the measurement of Internet Audience. For this STIR was founded, an association for the promotion of internet advertising with the objective to achieve an equal status within the range of media for media planning. The combination of Nedstat and Intomart GfK designed the new survey, the Webmeter™, which has by now provided the currency in the Netherlands for almost 5 years. In total 450 websites are reported monthly. In 2009, STIR has been transformed into JIC STIR, a joint industry body with the sole objective to carry out the survey in a valid and reliable way. Currently the survey is being audited by Deloitte. Partners in JIC STIR are the advertisers’ Association (BVA), the media agencies (PMA) and the internet publishers (Vinex, previously STIR).
The Webmeter is based on a new concept of internet research, combining server-centred and client-centred approach into the method of “tracking through portal”. In this way, the Webmeter methodology is independent of the location where individuals browse the Internet. Any surfing behaviour can be tracked, either at home or at work or any other location. The survey delivers identical metrics as traditional media research. By offering these type of figures the Internet sales houses have been able to achieve their proper place among media owners and thus a growing market share of advertising in the Netherlands.
The STIR survey proves to be a catalyst for the development of multi-media approaches in the Netherlands. In 2009 tests have been done to combine streams measurements with SKO TV programme reporting. Also in 2009 the fused NOM and STIR data have been released for the first time, providing a single database for planning and analysing paper and internet based media.
2 Background
Basic requirement for an audience measurement survey is its acceptance by media planners as the currency for planning, buying and selling of ad space on the Internet (Moesman, 2005).
STIR was brought to life by a group of Internet providers (MSN, Lycos, Tiscali, Sanoma, Ilse Media, Wanadoo, IP iMedia) and ad-sales companies (WebAds, Adlink) who understood the requirements of the market for such a survey. The group represented some 40% of ad-sales in the Dutch Internet advertising market. Not being a JIC, STIR sought to obtain the acceptance of the market place for its initiative. The only way in which this could be achieved was to involve all market parties in the process of developing a new survey model.
STIR invited both advertisers and media agency associations to participate in this process and gave the design of the tender document into the hands of a technical committee (TC) of advertisers and media agency representatives, plus a small number of researchers from the Internet companies and other media such as the public broadcasters’ website.
The tender procedure was fully managed by this independent TC, which reviewed 14 different proposals. Intomart GfK and Nedstat was rewarded the contract to carry out their Webmeter proposal (Appel 2004).
The properties of the Webmeter design met STIR’s objective:
- The Webmeter methodology is independent of the location where individuals browse the Internet
- The methodology supplies identical metrics as in traditional media research
- By offering these type of figures the Internet sales houses expect to achieve their proper place among media owners and thus a growing market share of advertising in the Netherlands.
3 The concept of the Webmeter
In deciding which method is best suited to measure Internet behaviour according to the requirements of STIR, a comparison was made of the following historically used methods:
- Questionnaire-based surveys, mostly by telephone, asking people about the visits they made to websites.
- Panel surveys, asking respondents to fill in a diary
- Pop-up surveys on selected web-sites, collecting data via a questionnaire
- Site centric measurements, such as log files or pixel based services
- Browser-centric measurements where panel members have their Internet visits registered by means of a downloadable software
Each of these methods has specific advantages and drawbacks:
Ad. 1. Survey research by means of questioning people is independent of metering and easier to achieve random sample requirements. However, they are unable to provide the level of detail that is needed today: media planners want to use both reach and frequency and a certain level of time planning to be able to target audiences by means of multi media campaigns. A second drawback of survey methods is the fact that data heavily depend on respondent’s memories. This often leads to over-estimation of well-known websites and underrating of lesser known ones.
Ad. 2. A diary can assist the respondent in his job to remember which websites were visited. Even though this method seems feasible, its limitations are obvious because of the huge number of web pages that needs to be measured. Diary logistics prevent its usage for website measurement. At the same time, one might say that paper diaries are far removed from the electronic environment of the Internet behaviour involved.
Ad. 3. Pop-up surveys are a relatively inexpensive method, but the representativeness of the survey is difficult to steer. Also, response rates are generally low and the number of questions to be asked is limited.
Ad 4. Log files give a full testimony of the number of visits to the website and to a certain extent these seem to give hard and correct numbers. Apart from the fact that log-files are difficult to handle, they are also difficult to interpret: which visits come from the same person? Several other difficulties present themselves such as the occurrence of proxy servers. On top of these technical limitations, there is no profiling data available about the visitors.
Ad 5. Panels have been installed around the world using software to measure visits to websites. These panels have hugely increased the level and quality of the data available. The acceptance of the service was hindered by the fact that an incomplete picture is given: all efforts to include web visits from business- or school-PC’s have been unsuccessful or impractical.
In answer to STIR’s request for proposal, Nedstat and Intomart GfK have developed a new methodology to measure the full range of Internet behaviour of panel members under the name Webmeter™. Its methodology is called: Tracking through portal, measuring coded websites in a panel, and surfing from any browser that is to their disposal.
Bringing together the expertise of Intomart GfK in measuring media usage by means of panels, gained during 40 years of Radio and TAM research, and the Internet measurement of Nedstat (by means of their key product Sitestat), the new Webmeter concept brings the full advantage of both worlds. The combination is able to comply both with the ABC-standards as agreed in many countries and with the media planning requirements in the Netherlands.
The methodology is based on the TAM-concept, inviting a panel to participate over a longer period by enabling their web surfing behaviour to be measured. This then had to be measured from any location, work, at home, at school or university, etc.
Inherent difficulties of web measurement are:
- How to recruit a panel that is willing and able to participate from any location?
- How to measure visits generated by panel members, irrespective of location?
- How to report, single source on reach and frequency?
- How to exclude surfing by other people using the same browser/pc?
- How to include all surfing behaviour and control for missed contacts?
- How to meet requirements from both the Internet and the media world?
- How to set up a full database of target group characteristics as is required in media planning?
In the next paragraphs we shall outline the survey design and the way in which these questions are being tackled.
The central solution is formed by Webmeter itself, which is not a meter in the traditional sense and not even a software programme that needs to be installed on a panel members PC (‘s). The Webmeter solution is independent of software, which makes it possible to overcome the difficulties of out-of-home measurement, when people are at work, at school, in libraries or in Internet cafes or use other ways to access the Internet. The methodology is Tracking Through Portal.
Around the Webmeter the full research model is built.
4 Webmeter design and functionality
The Webmeter is based on the Sitestat web analytics service of Nedstat. Nedstat started its web traffic analysis services in 1996 and measures now over 1 million homepages, more than 10.000 business websites and almost 2000 large professional websites throughout Europe.
Pixelbased method
Websites insert a tag (the pixel request) to each webpage. This pixel request generates a measurement on the Nedstat servers each time a browser visits a webpage. A Javascript placed on the web server completes the measurements by scanning the settings of a visitor’s browser, capturing information about cookies, referrers (search words, search engines used, previous URL visited) and technical browser information (screen size, browser version, operating system etc.). All data are collected in realtime, by the browser and in e-mail.
To use Sitestat for the Webmeter some modifications have been made in order to recognize panel members among the website visitors. In order to do so, special cookies are issued. The measurements are conducted according to ABCe regulations.
Panel members log into the Webmeter using any browser they have access to.
Figure 1 – Login to Webmeter
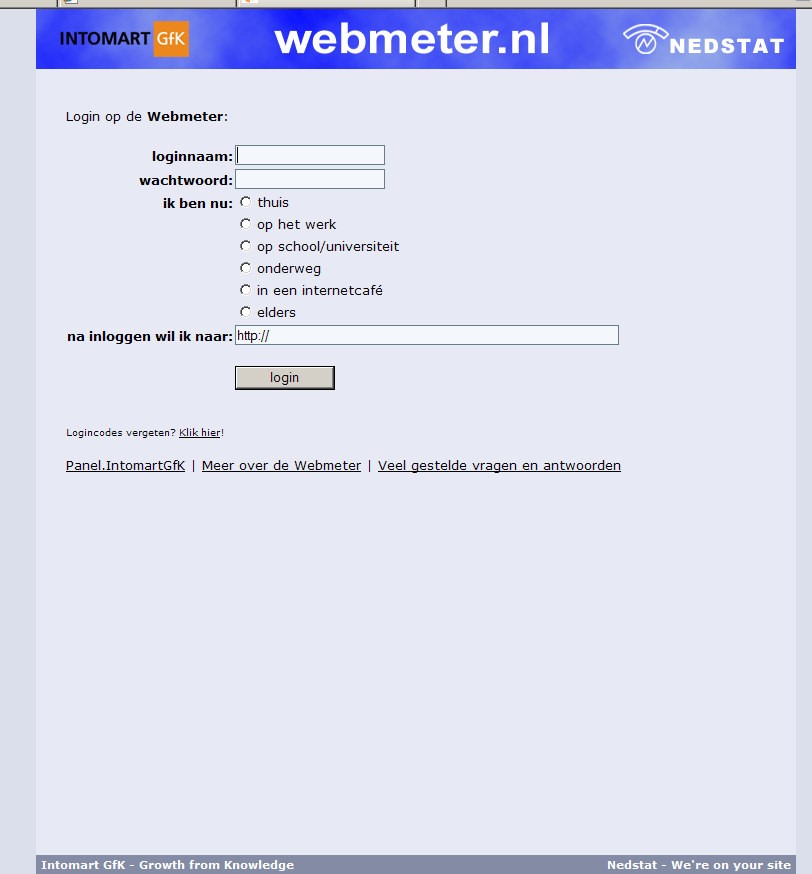
The panel member specifies the location from where the Internet is surfed (home, work, school, Internet café, elsewhere). The last know combination of panel member and location is recognized automatically when the panel member surfs the Internet with this browser a next time. The Webmeter checks if the necessary cookies are still present and valid. As it is known that cookies are lost after a certain time, cookies will automatically be refreshed. As the Webmeter does not require software or toolbar installation, it can be used from any location that a panel member surfs the Internet.
Members of a household that share the same PC with a Webmeter panel member, need to be instructed what to do when surfing the Internet. In principle household members can become panel members. If they are not a panel member themselves they are requested to check the box “other person” in order to exclude their surfing behaviour from the measurement. If family members have their own specified domain, there is no need at all for identification.
Recruitment of the Webmeter panel is a crucial element of the Survey design: the panel must be representative of the Dutch population of Internet users, in the same way as the TV audience panel is for TV viewers. We have selected a similar procedure for the recruitment and balancing of the Webmeter panel:
- A random probability survey to establish the size and structure of the Internet population in terms of frequency of usage and define the relevant variables for the panel structure. This would normally be age, sex, education, frequency of Internet usage, etc. This survey will be conducted twice a year to follow trends and changes in the Internet population structure brought about by e.g. the rapidly growing penetration of broadband Internet access as is currently happening in the Netherlands.
- Recruitment of the Webmeter panel is based on the Internet population structure derived from the establishment survey.
The recruitment base is formed by the 130.000 respondents of Intomart GfK’s on-line panel, which is a high quality access pool of individuals recruited from random telephone and face-to-face surveys carried out by Intomart GfK. This pool is constantly refreshed with new recruits who are asked to fill in a profile questionnaire with a comprehensive set of demo’s and selection variables. The current size of the Webmeter panel is 10.000, of which 1.000 are virtual members representing the 16% noninternet population. These virtual panel members are interviewed only once. The Webmeter database is projected to total population 13+.
5 Panel Management
As important as the recruitment of the panel is its daily management and quality control.
As in a TAM panel, panel members are instructed to comply with certain rules, such as entering the Internet via the Webmeter starting page, allow cookies to be placed, identify themselves and other users of their PC. It is therefore most important that actual behaviour of panel members can be checked for this compliance. We have several built-in anonymous controls that are collected by Nedstat. All control results are transmitted to the Intomart GfK panel management, who will then decide whether a further instruction is needed and the panel member should be contacted. If compliance is not improving the panel member will be removed from the panel.
Intomart GfK validates the surfing behaviour of panel members, based on the collected page views and visits per location on:
- correct registration
- surfing without registration 3 different locations at the same time 4 etc.
Also, the measured surfing behaviour is checked against the estimates the panel member has given at the recruitment stage: if a frequent Internet user has not been detected for a while on the Internet, we need to find out whether there is a technical difficulty or whether the respondent is not complying to the rules.
If inconsistency is noticed, Panel management may eventually contact the panel member by e-mail or telephone. Worst case, the measurements are taken out of the data.
6 Website coding and daily data collection
Web pages are coded according to ABCe regulations with a tag (pixel code). This tag represents the logical name of the webpage (e.g. ‘homepage’ would be the name of the homepage webpage). Web pages visited by panel members are automatically registered in Sitestat with their panel member number as visitor identifier.
STIR wants to provide targeting information not only on the level of Website to advertisers and media agencies associations, but also on the level of Channels. To give an example: advertisers want to know what the target group is that can be found on http://MSN/car/ web pages, and what the overlap is with visitors to http://Tiscali/car/ web pages? In order to differentiate website visits into channels ‘labels’ are used in the tag to identify the channel that a certain webpage belongs to.
Ad campaigns can be measured using ABCe measurement types “ad views” and “ad clicks”. These measurements are separated from normal page impressions, which are the basis for Internet Audience Measurement. The reach of ad campaigns can be reported separately.
Code check
An important aspect for the correct functioning of the Webmeter is to control if web pages are tagged, and whether they are tagged correctly. Nedstat runs a weekly check on all participating websites and reports to the members, which web pages have not been or incorrectly coded.
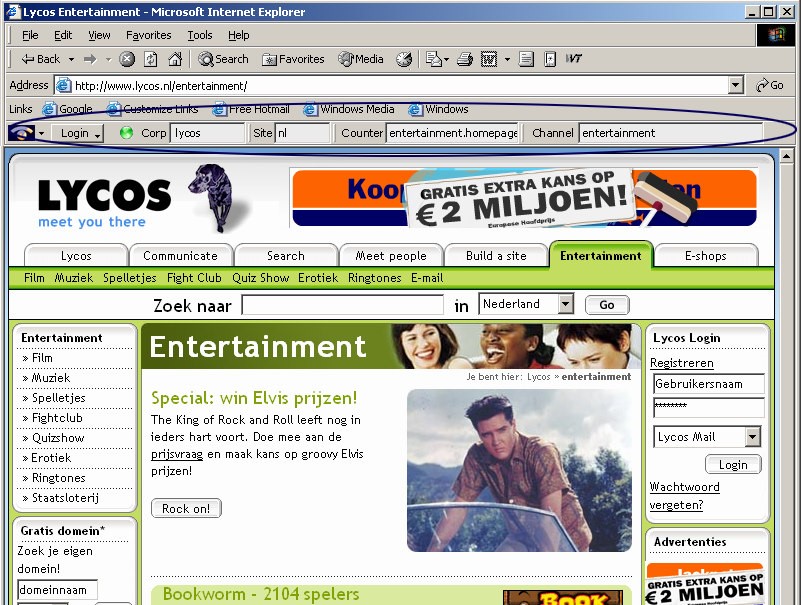
In addition, a toolbar is provided to STIR participants that instantly shows (green light) if a webpage is tagged correctly, and what values have been given e.g. name of the channel.
Figure 2 – Toolbar to display code on webpage
Processing
Daily, Sitestat processes all measurements according to ABCe regulations into Page impressions, Visits and Visitors. Nedstat passes this raw data on a daily basis to Intomart GfK. Intomart GfK has access to the individual information of panel members for validation purposes. Nedstat only recognises panel members as anonymous numbers.
In addition to measured surfing behaviour, quality control data is passed on to Intomart GfK, who can take adequate steps to guarantee the validity of the data and act upon signs of non-compliance.
7 Reporting
At the end of the month, the panel data is weighted against the Establishment survey to assure a representative Internet Audience Measurement on a monthly basis. The level of the data is daily, offering media planners the opportunity to evaluate schedules and campaigns up to the day, comparable to TV-data.
The following results are reported from the Webmeter panel data:
- Reach of the STIR web sites (daily, weekly, monthly)
- Frequency (daily, weekly, monthly)
- By target groups (demographic, product usage, media usage, life style)
The websites are classified according to a site classification of 20 categories, prescribed by STIR, as well as directories and advertising packages as entered by the internet publisher into the code. This enables users of the data to track down to page level if they so wish.
The data have been reported monthly since February 2004. There have been two increases of the panel size, from the initial 4.000 to 6.000 in 2007 and 10.000 in 2008. Participants are 60 publishers of 450 sites.
8 Media Planning
The use of a panel for measuring Internet behaviour is not only a practical solution for measuring reach and frequency in a representative research survey, it also enables the user of the data to analyse to the level of target groups.
Apart from the information collected in the recruitment stage, panel members are requested to fill out questionnaires several times per year. This data will enrich the monthly refreshed reporting. Data is available through specialized media planning software, both for analysis and for optimizing media schedules.
9 Market share measurement
One important aspect of the Webmeter methodology is its limitation to websites that participate in STIR: a code needs to be inserted in all pages to be measured. The results of the Webmeter panel will create a full picture of reach and usage frequency by the Dutch population, but only for a limited number of sites from participants. There is also a need for the full picture: what is the proportion of total Internet usage, made up by visits to the group of STIR-allied websites? What is the current top list of websites? Which new sites are gaining importance? For this type of measurement a smaller panel of 1.000 is installed with PCbased Market Monitor software that measures the visits of panel members to any website. The results of this panel are reported twice a year.
Figure 3. Top-list of websites in the Netherlands (source STIR Internet Market Monitor, 2009-I)
| Rank
(2009) |
Website | STIR-
participant |
| 1 | google.nl | – |
| 2 | google.com | – |
| 3 | hyves.nl | STIR |
| 4 | youtube.com | – |
| 5 | Hotmail.com | STIR |
| 6 | marktplaats.nl | STIR |
| 7 | passport.net | – |
| 8 | wikipedia.org | – |
| 9 | ing.nl (voorheen postbank.nl) | – |
| 10 | startpagina.nl | STIR |
| 11 | detelefoongids.nl | STIR |
| 12 | bol.com | – |
| 13 | live.com | – |
| 14 | rabobank.nl | – |
| 15 | buienradar.nl | STIR-A |
| 16 | nu.nl | STIR |
| 17 | microsoft.com | – |
| 18 | msn.com | – |
| 19 | rtl.nl | STIR |
| 20 | telegraaf.nl | STIR |
Although the Market share measurement is based on in-home PC-usage only, the findings can serve as an estimation of market shares of the STIR sites. We have estimated a market share of STIR sites amongst the top 100 sites in the Netherlands of 60%.
10 Webmeter 360˚
The STIR survey has played an important role in developing the multimedia perspective in the Dutch market. Two successful experiments have been conducted, the first one initiated by NOM and STIR, the second one by SKO and STIR.
NOM-STIR
Members of STIR are often active as publishers of newspapers and magazines. More and more traditional and electronic media are becoming equal counterparts or full twins within the operations of the publisher. Advertisers and Media agencies are interested to see the full picture of all media before making strategic decisions about their budget allocation.
Bringing the two worlds together was one of the major objectives of STIR: how to compare reach and frequency to the hits and page views in the new world of internet. Once STIR became a respected source for planning and evaluation of campaigns, the actual step towards bringing the two together into one database got top-priority on the list. NOM and STIR started a combined project to provide the market with one single database for print/internet planning, based on the NPM/DGM data, enriched with the results from STIR Webmeter measurements.
The data collected for NOM in the national readership survey NPM and the target group survey DGM has a hugely different format than the STIR data. NPM/DGM delivers reading probabilities and a huge amount of quality of reading data. Webmeter provides day-to-day surfing behavior, its currency defined as monthly reach. The NOM-STIR fusion project aimed at bringing these data together and calculate combined reach for both public forms of the measured media: a publisher can now report on reach and frequency of its paper version in combination with the performance of the newspaper’s website.
STIR and NOM have commissioned Pointlogic to perform the fusion of the two surveys, resulting in a single database for strategic analysis of the combined reach of paper and electronic titles. The data were released and are for the first time available in summer 2009.
SKO-STIR
TV stations are providers of a large part of the video that is available on the internet. Catch-up TV is very popular amongst the Dutch population, both via settopbox and via the internet. Measurement of catch-up-TV via the TV-set is included in the TAMpanel measurements and reported on a daily basis in the SKO ratings. More and more, TV-programmes are watched on the computer, through the broadcaster’s websites. Reporting on the impact of these video requests became an important issue within SKO in the past year: how to measure the total amount of TV-viewing, irrespective of the equipment used by the viewer.
The experiment of SKO and STIR aimed at reporting streams that are identical or linked to TV-programmes. The start of the project was made possible because Nedstat’s product Stream Sense was in use by most of the TV-stations and public broadcasters. Participants in the SKO project were NPO, RTL and MTV. Soon to be followed by SBS. By matching the streams with the programme title base of SKO, a top list of stream requests of TV programmes could be constructed. (De Vos, 2008). Included in the report are all programme streams that have been requested within 6 days after the broadcast (identical definition compared to time shift viewing). The results are published daily on the SKO website.
The second phase is a test on the TV-streams measured in the STIR Webmeterpanel, for which SKO and STIR decided to work together. As the title match has been established within the top-list reporting in the SKO project, the same analysis can be performed within the Webmeter panel. A stream request can then be linked to individuals and the report can include reach and profile of viewers. This test is currently under way.
MOBILE
Websites and applications designed for mobile phones will show significant growth in the coming years. Nedstat is already measuring these websites and applications for several clients, as the VOD streams project has shown. Mobile consumption will be an important segment of the market for STIR to add to the existing Internet audience numbers. The same will be true for TV and Radio. The first phase is likely to be measuring websites, applications and streams designed for mobile devices on a total requests basis. The next step is to set up a panel of mobile users for audience measurement. The Webmeter concept, adapted for mobile use, is one of the options.
11 Conclusion
The measurement solution provided by the Webmeter panel as a full-scale media audience measurement, is designed to meet the standards of the Internet publishers, the media planning society and the advertisers:
- Objective establishment of the size and structure of the Internet population
- Daily measurement of visits to websites from any location or browser used
- Full demographic, media usage, life style and product usage data of the visitors 4. Establishment of the market shares of all web sites, based on in-home visits
5. Detailed monthly reporting of reach and frequency of websites.
During the past 5 years STIR has an increasing group of participants as well as regular users of the survey data. An important element of the turnaround is the availability of user-friendly, dedicated software that helps not only in analysing the data but also to understand the way in which the internet works. The internet has become a serious player in the media world. This is underlined by the fact that the leading JIC’s have sought cooperation for joint projects with STIR.
References
2008 De Vos, Bas, Irazoqui, Mariana, Verhulst, Enrico, Bok, Gerwin, Streaming TV: making the connection; Extending measurement to evaluate overall programme performance. Esomar, 2008.
2005 Moesman, Sebastiaan, Camps, Camiel & Appel, Marion, Webmeter , Internet Audience Measurement wherever you are, in: Week of Audience Measurement, Esomar, 2005
2004 Appel Marion & Verhulst, Enrico, Webmeter , Internet Audience Measurement for Mediaplanning, in: Week of
Audience Measurement, Esomar, 2004