Dr Michael Hallemann, Gruner + Jahr AG & Co. KG
Gabriele Ritter, Media-Micro-Census GmbH
Worldwide Readership Research Symposium Valencia 2009 Session 7.3
Introduction
All media planning campaign strategies, and the controlling of their effectivity, call for a time-based component. Past and future advertising media exposures can, however, only be inadequately recorded and forecast by readership research studies based on the Recent Reading model. Information relevant for planning such as multi-magazine exposures, the build up of reach and exposures over time, as well as the quantity of time spent reading magazines and daily papers are inadequately reflected in the usual currency studies of the press media. The Media-Analysis joint venture has therefore decided to fill this gap and to expand its previous survey and analysis methods in the long term.
After the intensive assessment of recent developments in international print media analysis, “MediaScan” was chosen to implement this measure. The idea is that the end of a standard media analysis survey is followed by an additional survey in which volunteers register all of their reading processes by scanning in the printed barcodes. The additional information acquired in this way will then be linked to the reach data. The reach data itself remains unchanged by this process.
After presenting the basic model ideas, and the information that they can be used to extract, this paper also presents the initial experience gained by this experiment and the modelling steps.
Background
The technical commission of ag.ma reviewed a number of different modern surveying possibilities for print analysis in 2007, and assessed them for their implementation feasibility for media analysis in the future. The findings were published in the brochure “New developments in print media research – an assessment“. The study looked at different methods: Specific Issue Readership, Weekly Average Page Reach, MediaScan, MediaWatch and RFID-technology.
The conclusions of this study:
There was no clear preference for any of the undoubtedly interesting and innovative research methods to, for instance, replace the standard media analysis method used by ag.ma. With the exception of Specific Issue Readership using copies of cover pages
– and there are also still a number of open questions to be answered concerning this method – none of the interesting new research methods can be adopted 1:1 for reach analysis.
The only opportunity for obtaining representative data, which also provides more planning data beyond that already made available by the existing currency, was therefore seen in a combination of various methods. The representative reach survey still plays an indispensable part here, and given the still unanswered questions concerning SIR that existed at the time, this meant that only the Recent Reading model was available for the media analysis.
The Belgian WAR experiment1 in collaboration with Masson & Sumner2, which involved recording reading processes in a fortnightly diary, has a certain attraction. The panel approach here could actually give rise to the acquisition of very valuable additional information on the time-based usage of magazines. However, MediaScan, instead of a written diary, is perhaps a more “modern” method for recording exposures with magazines.
The ag.ma committees therefore decided in favour of MediaScan as an additional method for recording the use of magazine and newspaper details. Note that the “currency” remains unchanged by this process, it is only modernised and expanded by a “technical measurement”.
1 Patrick Hermie, True Lanckriet, Véronique Couvreur & Koen Lansloot, Sanoma Magazines. The WAR project. A Small Step up the ARF Media Research Ladder. A Giant Step Forward in Magazine Planning. In: Worldwide Readership Research Symposium, Prague 2005, Session Papers, p. 317 ff
2 Peter Masson, Dr Paul Sumner, Bucknull & Masson. An Improved Method of Collecting and Processing Readership Data. In: Worldwide Readership Research Symposium, Prague 2005, Session Papers, p. 329 ff
Basic Idea:
The important basic idea for the model approach is that the media analysis and its reach evaluation remains unchanged and therefore forms a representative survey – a benchmark – for all of the additional information acquired via MediaScan, and the associated calculation methods which become necessary. As already mentioned above, this is actually a combined methodological approach aimed at merging the benefits of each method – representativity on the one hand, measuring technology on the other. The job of MediaScan here is not to measure the absolute reach but to record patterns of magazine usage, i.e. following the representative ma-reach survey per CASI, volunteers are to be recruited for an additional survey using a small hand scanner. These recruits will be asked to register every reading process over a period of 2 – 4 weeks per person – whether at home or elsewhere – by scanning in the EAN code of the magazine or newspaper prior to reading, and entering the end of the reading process by pressing a button. Some of the devices will be equipped with displays in future. In addition to the scan procedure in these cases, a small scale will show upon request the quantity read after each reading process.
It is quite obvious from the start that the data acquired via MediaScan with this approach is distorted in many ways:
-
- The sample is incomplete because not all of the people surveyed by ma will volunteer to participate in MediaScan. This distorts the panel structure, and not all reach interviews will also have single-source MediaScan information.
- Recording the reading processes is incomplete and has gaps. However, the scanner data will be adequate to record prototypical types of reading behaviour.
Because the representative ma sample and its reach findings can provide an anchor, it is possible to correct the distortions and the gaps by computer data modelling. Analogous to other types of media (online, posters, etc.) the reach research for print will then rest on several pillars, including a “technical” measurement.
What additional data can be acquired?
The objective is to supplement the reach with new additional information on print usage – seamlessly for ALL ma respondents. The following parameters can be acquired via MediaScan:
-
- MediaScan provides data on the number and times of exposures with magazines.
- This can be used to derive the structure of the reach in time.
- It records the number of exposures with a specific magazine (pick-ups), as well as the precise reading duration.
- The reading quantity inquiry via the display scanner supplies the quantity read per reading process.
- This and the already existing ma data can be used to calculate the page exposure per magazine, i.e. including the number of pages opened up several times.
- The calculation corrects to the best possible degree the sample distortions of the scanner data and the missing values. As already mentioned above, this is only possible by anchoring the additionally acquired data to the representative reach survey.
First experimental steps
Two pre-tests were conducted between October ’08 and March ’09:
Firstly, as part of the media analysis CASI, respondents were additionally asked if they were willing to volunteer for a subsequent survey using scanners to record reading processes.
Secondly, the methodological test was conducted with around 300 apportioned selected persons to provide an initial insight into the use of the scanner, and to acquire data to develop the first model drafts.
Experiment 1: response test
The primary objective of the response test was to find out how many CASI respondents would volunteer for a survey using a hand scanner. This information was vital for the continuation of the research work.
Following the normal ma interview, one of the seven ma institutes surveyed the potential willingness to be recruited for reader scanning. It therefore concerned the pro forma willingness to participate in a random study – those willing to participate were not expected to take part in a real study yet. The influence of incentives and participation duration were also surveyed. In half of the cases, the respondents were shown a demo scanner, whilst the other half were shown optimised diagrams (e.g. with a comparison of the size compared to a key ring). This methodology provides additional findings on whether it may be possible in future to recruit volunteers without a scanner – very important given the number of devices which would have to be kept available.
Other treatment factors were participation duration (1 week / 2 weeks) and the size of the incentive (Euro 10 / Euro 30). 1354 people in all were asked about their willingness to participate.
The potential conversion rate averaged 26 % and reduces for longer research durations. Nevertheless, the wearing period should not be less than 2 weeks because we would otherwise not be able to adequately record the monthly publications in particular. The strongest influence on response is participation duration, with generally higher response for shorter test periods. The next most important influencing factor is the incentive. Demonstrating the scanners live has hardly any effect.
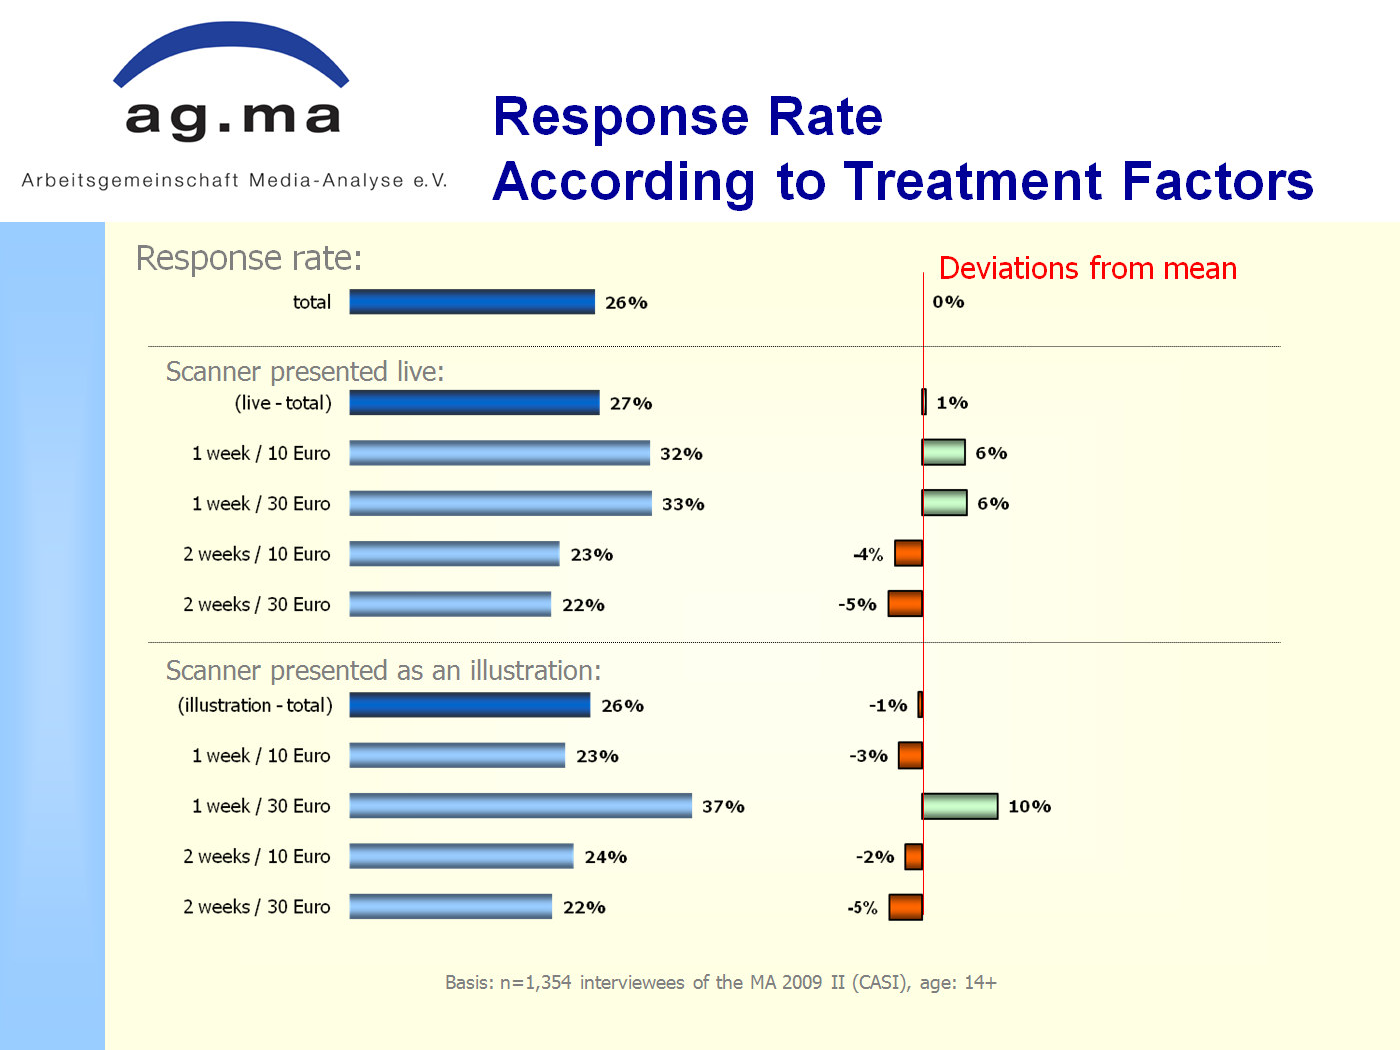
This conversion rate is considered to be adequate to identify patterns in the print usage.
Experiment 2: Methodological test
The methodological test was also carried out in October/November 2008 with 331 persons selected as being representative of the population. In three overlapping surveying waves, each participant was equipped with a mobile scanner, and half of the test persons were also equipped with a diary, to record their reading processes in this way as well.
The objective of the methodological test was:
-
-
- To identify the logistics challenges in the field
- To record the frequency, duration and times of reading processes during the day
- To validate scanning results by way of a diary kept by half of the participants, to e.g. gain an initial insight into the gaps which occur in the measurements
- To acquire data for subsequent modelling considerations.
-
Research procedure
In the first step during a screening phase, population-representative persons willing to participate were recruited. A 10-minute start interview was then carried out with the recruits, which also determined the usage of a selection of magazines and daily newspapers. This was followed by instructions on how the scanner functions – and with the relevant sub-sample – an explanation of how to fill out the diary properly. The scanners and diaries were collected after two weeks, and a follow up interview was carried out to acquire information on the use of the scanner, etc.
Findings:
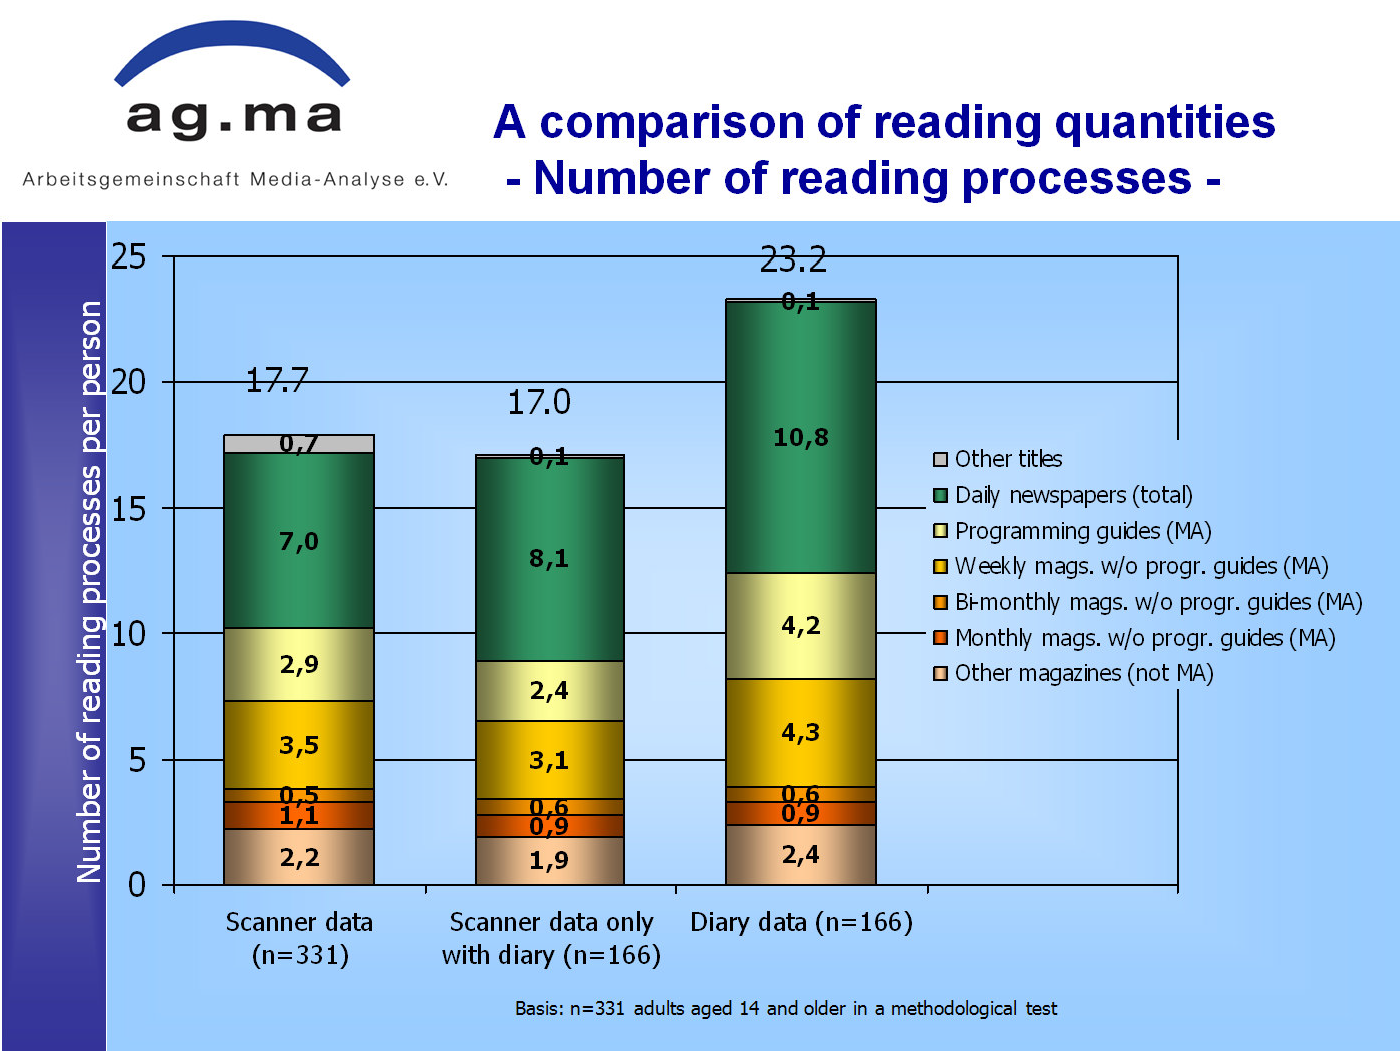
- Comparison of reading quantities scanner/diary
The following diagrams show the scanner data, scanner data only with diary and the diary data. With respect to the number of reading processes, the diary during the 2-week participation period had 23.2 recorded reading processes compared to
17.7 scanned reading processes – in other words, around one third more reading processes (see figure). Over this period, each recruit read five different titles on average, with similar figures for scanners and diaries (not shown here).
Of the reading processes recorded more frequently in the diaries, these were particularly made up of programming guides, weekly magazines and daily newspapers, which in the time period between 24:00 – 6:00 in particular were only recorded in writing.
The total figure for reading duration was also around 19 % higher in the diaries.
Those titles making a greater contribution to the reading duration recorded in the diaries include an over-proportional share of programming guides, weekly MA magazines and non-MA magazines – the monthly MA magazines in contrast have an even shorter duration. The reading duration per day was 50 minutes according to the Scan, and 62 minutes according to the diary. More reading processes are also registered in the diary at night and during mealtimes.
It can be concluded overall that a comparison of the diary data with the scanner data reveals that the diary contains more reading processes and a bigger range of titles. The reading duration is also higher in the diaries. Programming guides, weekly MA magazines and newspapers in particular contribute to the higher gross volume in the diaries. Monthly MA magazines, however, have even lower reading duration in the diaries than in the scanners.
In general, the diaries record higher values during the night. In addition, the diaries also have higher reading volumes with daily papers in the morning, and magazines in the evening associated with the start of TV prime time.
The daily maxima recorded in the diaries are therefore the times of day which are frequently associated with highly regular other activities (e.g. mealtimes, journeys to and from work, TV usage). Another possible explanation – in addition to under-reporting from the scanner data – is also an over generalisation of reading behaviour in the diary combined with these activities.
The fact that this can be considered to be an influencing factor also makes it viable to conclude that longer publishing intervals (unlike short intervals) profit from the scanner surveys.
Comparison of participation weeks
During the second week, there is an across the board trend to less scanning from late morning onwards. Fewer reading processes are also entered in the diary during the second week at night and in the afternoon.
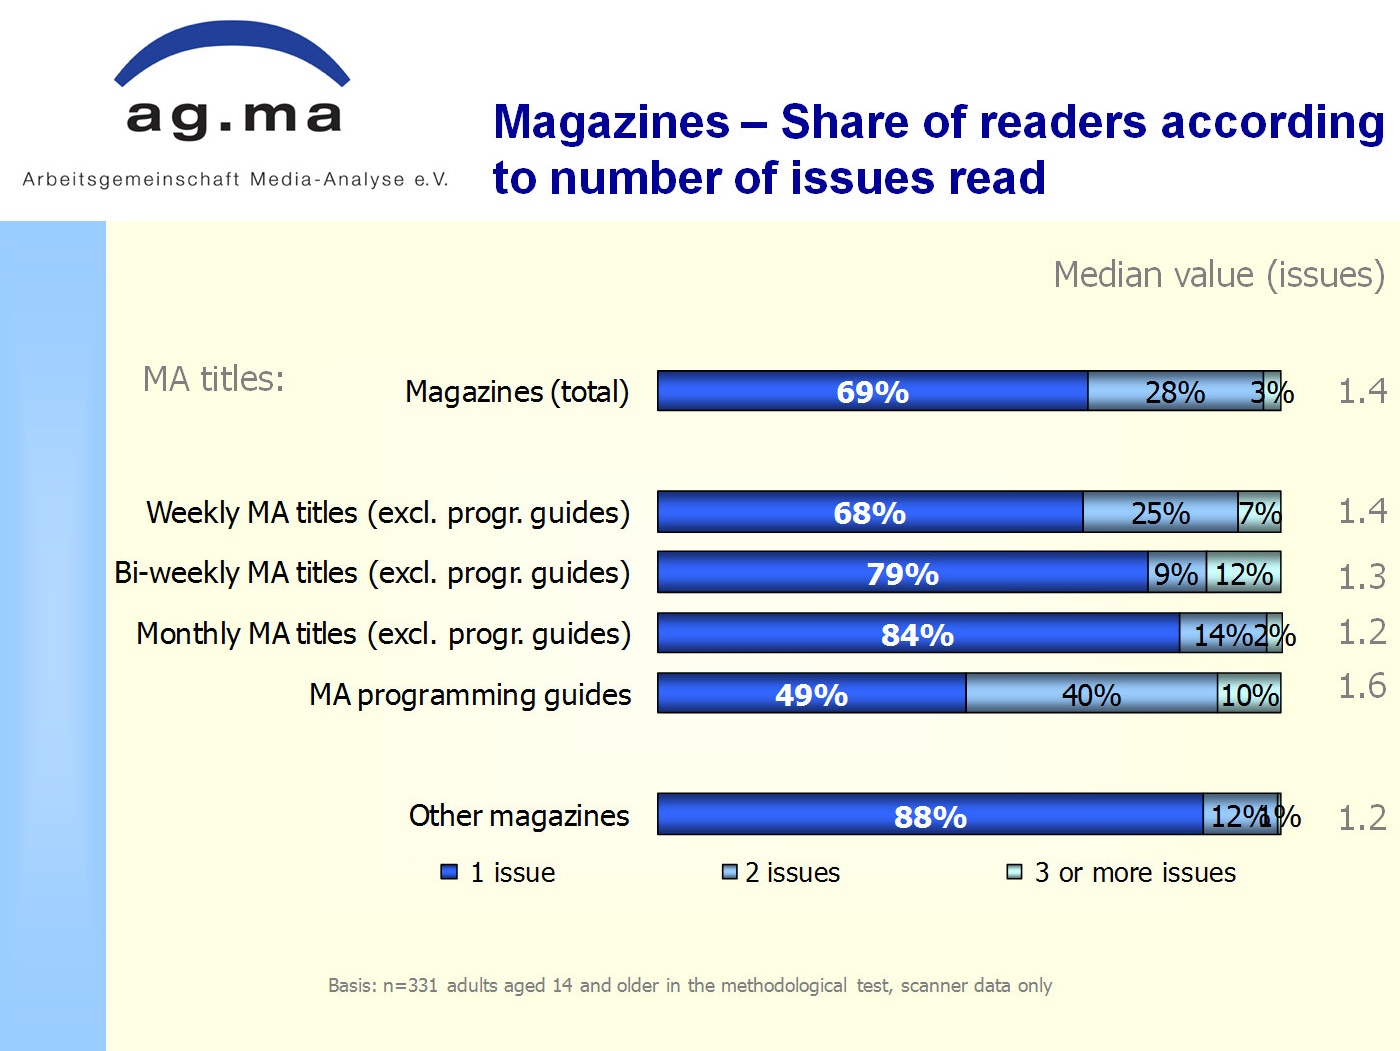
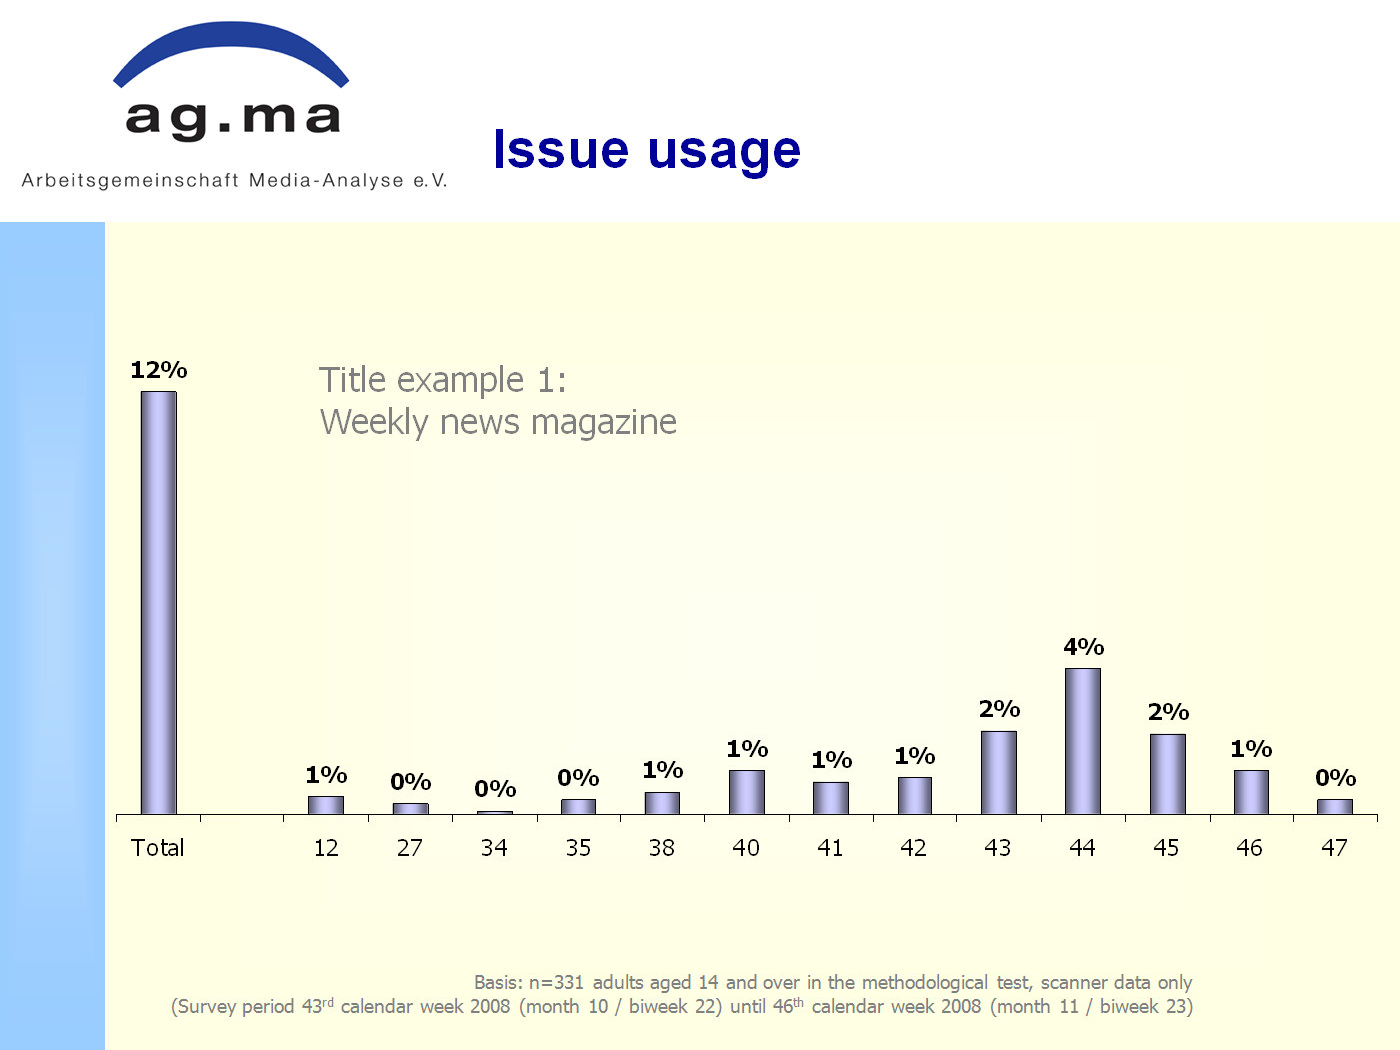
- Issues read (This analysis is exclusively based on the scanner data)
Around one third of the readers of magazines read more than one issue of a title during the survey period (averaging around 1.4 issues, see figure). This proportion is naturally lower with respect to titles with longer publishing intervals. Programming guides are as expected the titles with the most read issues. In all other respects, the publication interval had the greatest influence as expected.
The analysis of magazines with many reading processes as recorded in the scanner data is particularly interesting. E.g. a weekly news magazine gained readers from a total of 13 different issues during the 2 weeks (see figure). The larger share as expected involves issues 41 to 46, because the survey took place from the 44th to the 46th week. 35 publication intervals lay between the oldest and the most recent issues. There are also other examples with a similar amazing range of issues. The range and the time period bridged by the different issues could hardly have been surveyed during an interview.
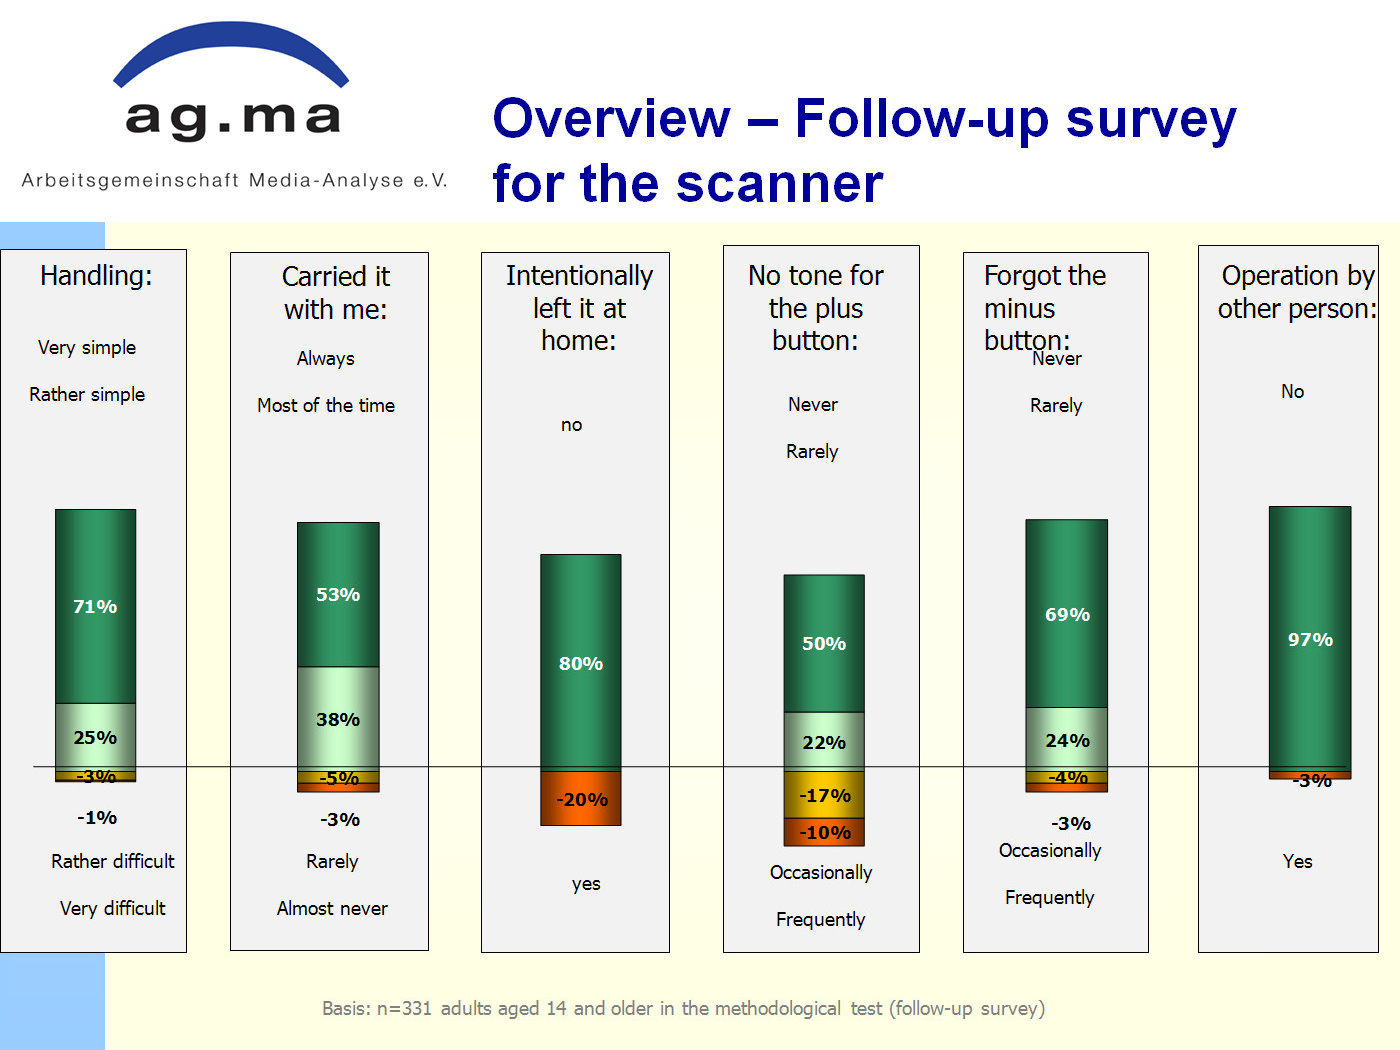
Evaluation of the study procedure
The follow-up survey mentioned earlier acquired information on the usage of the scanner. The only relevant aspects here are the carrying of the scanner away from home, and the feedback about the plus button (see figure). Most of the suggestions for improvements determined by the follow-up survey could be satisfied by making the buttons bigger, and having the scanner give clearer feedback on the current status. With these exceptions, the majority of the participants report positive conclusions. Only a few reported that the carrying of the scanner had an influence on their own reading behaviour. The most tiresome aspect was the obligation to think about the tasks associated with participation in the experiment, and particularly, filling out the diary. The additional input involving the diary should be reduced accordingly in future surveys by only using the diary to make entries not recorded in the scanner.
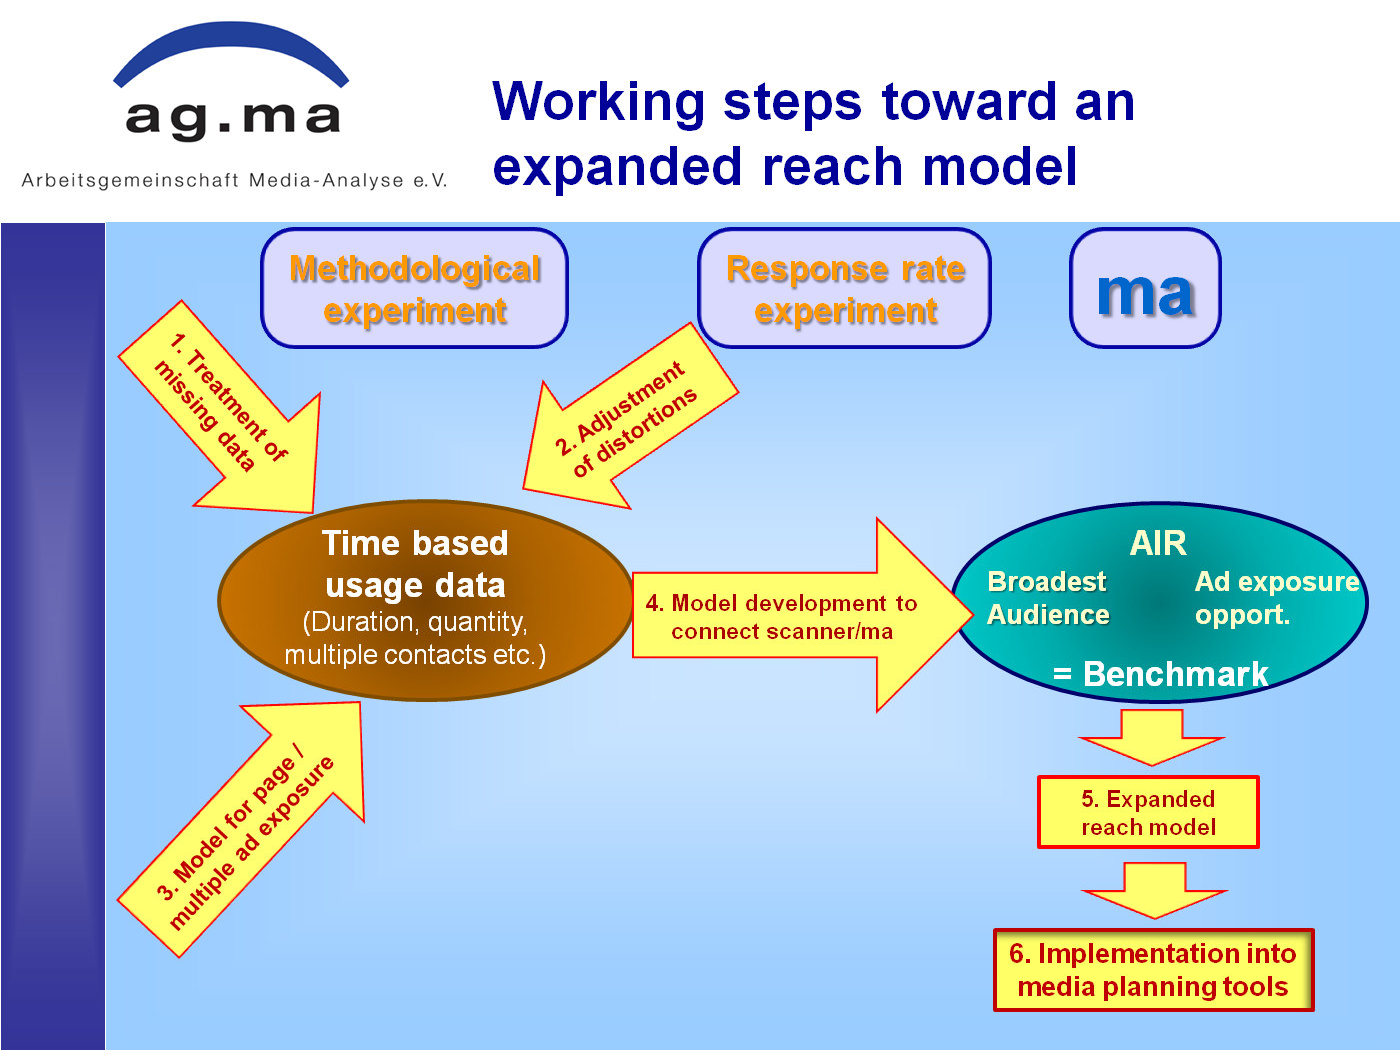
Modelling steps
As referred to earlier, it was obvious from the start, and was also confirmed by the experimental results, that the integration of the ma reach data with the scanner information makes computerised analysis essential – particularly to compensate for the sampling-related distortions and missing data.
The data from the MediaScan methodological test provided information on which to base the first modelling considerations. The 1st step involved analysing the data with respect to preparing measured values concerning average and specific tasks:
- Plots of the structure of the reach for types of titles (topical and news magazines, weekly programming guides, 14-day programming guides, weekly women’s magazines etc.) and possibly also for major individual titles
- Average magazine exposures, reading quantity and reading duration
- Treatment of “missing” data, e.g. forgotten scanning steps, forgetting to make an entry at the end of a reading process.
The next step concerns the
- Development of a model to compare the scanner data with the ma-p-figures and/or LpA, LpwS and WLK
- Development a model for multiple page and advertisement exposure from the available material (magazine exposures, reading duration per reading process, reading quantity per day according to the scale) taking into consideration the “conditions” given by LpA, LpwS and WLK
- Analysis of the conversion rate tests with respect to adjustment possibilities for the distortion of the scanner sample resulting from the different responses
- Development of a reach model taking into consideration the additional information acquired via the MediaScan, such as exposures over specific time periods (weeks, months)
- Converting the additional reach model into media planning programmes.
This kind of model is currently being developed by ISBA Informatik Service-Gesellschaft mbH in Hamburg.
The evaluation model basically follows the model of conditional probability as already applied by media analysis for the “readers per advertisement-bearing page”. Assuming that a person is the reader of a title – and that there is therefore a reading probability greater than zero – an additional probability is added for the advertisement page exposure. In a similar way, the data acquired by MediaScan on the time-based structure of the reach and the exposure growth for a specific issue, are added to the reading probability.
The scan time period unfortunately only incompletely covers the lifetime of an issue. This shortcoming becomes increasingly problematic the longer the publishing interval. Additional experiments carried out using MediaScan should therefore attempt to gain some recruits at least for a scan period of 4 weeks.
Without wanting to go into too much detail here, it is worth pointing out another difficulty: scans during the recording periods will not necessarily reflect the average magazine exposures of a specific person. Complications arise in particular with persons who read rarely and irregularly for example. The individual analysis is therefore supplemented by an aggregated analysis which ultimately serves to estimate the magazine exposures and reading frequency. The objective is to use micro-mergers, for which the reading frequency is a vital link – to extrapolate the scan data to the magazine OTS and the magazine reach structure to all of the media analysis respondents.
By making simple assumptions about uniform distribution, this data alone would also enable the calculation of multiple page exposures, because the media analysis not only contains data on magazine reach but also on average advertisement page exposure. Calculation of the page exposures could be improved by the scanner with display used in half of the cases. Here, a simple scale allows the number of opened pages to be recorded per reading process. A handling test revealed, however, that the data quality is much better when the users are asked about the quantity they have read after every scan and not for instance after every fourth scan. The regularity obviously simplifies the procedure for the respondents.
External data sources could also possibly be utilised in future to improve the validation and adjustment of the page exposures. In Germany at the present time for instance – not including ag.ma though – a large number of magazine-use-measurements harness RFID technology in households. This also highlights that ag.ma is on the right track with the experiments it is currently carrying out, although the journey may still hold many surprises and decisions. The vision to establish a broader reach model is valid: a model which incorporates the time-based use dimension, as well as the multiple exposures only available by print.
Next steps
A MediaScan real test began in the middle of September as part of regular ma press media. Two of the participating ma institutes are equipped with scanners, and at the end of the ma interview, recruit volunteers under realistic field conditions for registering reading processes via MediaScan. One of these institutes is testing a display scanner which boasts additional functions to support the respondents, such as an improved feedback function. In addition, extra information such as reading quantities/proportion of opened pages per user process, are to be determined per display.
Conclusions
If the additional experiment and the modelling steps proceed positively, we will not only be able to see the extent of the influence of a print plan overall in future, but also precisely when and how much this effect unfolds. This is done at the same time as maintaining all of the other performance values, and in particular, the reaches. They are not ousted, only supplemented by additional information ➔ Evolution instead of revolution
-
- Print can be planned better because time-based components can be controlled
- The effect of print can be highlighted better in effectivity studies
- The print performance can be completely revealed by multiple exposures
- A rise in intermedial comparability
- Improved comparability within the media type