Dick Dodson, Telmar Europe / Technical consultant to JICREG
Roger Holland, JICREG
Worldwide Readership Research Symposium Valencia 2009 Session 5.1
Executive Summary
JICREG has for twenty years provided a national database and planning system for regional newspapers.
Where regional titles have undertaken research to JICREG standards, this research has provided the audience data for JICREG. Where such research is not available the audiences have been modelled, using the total research base that is available.
The combination of these two datasets, at post code sector level, has comprised JICREG and has been and is being used by hundreds of publishers and media planners.
With the advent of digital publishing the NS (Newspaper Society) established the Portfolio Audience Group (PAG) to investigate how audiences for other media, owned by regional newspaper publishers, could be combined with their readerships in order to show their joint audience delivery.
This group established the Media Portfolio database, which hosts details of all the media opportunities, over 3,000 in total including more than 1,000 internet sites, provided by the regional publishers. At the same time they commissioned Dick Dodson of Telmar to gather the appropriate data and provide models for internet audiences, which were considered to be the top priority rather than radio and other media opportunities, in order to be able to include internet audiences alongside newspaper readerships in the JICREG database and planning system.
This document describes in detail the whole process, which has now (May 2009) launched JICREG reports that include both readership and internet audience data.
An extension to the system that will allow schedule planning of both media simultaneously will be launched in the autumn of 2009, when the bureaux which run the planning systems have re-programmed their systems to be able to manipulate the new data. This should be live in time for the presentation in Valencia to show live data and analysis.
The importance of this project to the regional newspaper industry cannot be under-estimated because of the decline in traditional revenues (both circulation and advertising revenue) due to the recession and the switch to digital.
The project was borne out of a frustration that no industry internet currency was imminent, particularly for small, local sites. What was available was not industry approved and, at that time, not available cost effectively for small sites. Yet the publishers needed to be able to show what their internet sites delivered in conjunction with their newspapers in order to retrieve lost revenues.
The Portfolio Audience Project
In 2006 The NS established the Portfolio Audience Group (PAG) with a remit to establish and introduce into the market audience data for all the media opportunities provided by NS members.
It was agreed that internet audience data was the priority. Two parts to the project were agreed:
- To establish a database that would provide the ‘universe’ of opportunities
- To collect existing audience data and investigate the potential for integrating internet audiences into the JICREG system
The first part of this, the Media Portfolio Database, was undertaken by the NS with software written by Adweb. The second part was sub-contracted to Dick Dodson of Telmar, who is the JICREG Technical Consultant.
The NS Portfolio Audience Group has guided the project throughout. In addition JICREG has become increasingly involved in order to ensure the successful integration of the projects results into the JICREG system and through this the IPA and ABC have also been involved.
The Media Portfolio Database (MPD)
The internet-based Media Portfolio database as established by the NS currently has details on the following media:
| Print opportunities, magazines etc | 1,176 |
| Radio | 14 |
| Specialist Sections | 1,268 |
| TV | 1 |
| Web | 969 |
| Total | 3,428 |
With regard to the web sites specifically the database can hold the following Information: Name & Web address
Advertising rates
Screen shot of home page
Unique browser figures, daily, weekly, monthly, with date and source Page impressions with source & date
Linked newspapers Subjects covered Contacts
All data on the MP Database are input by publishers via an internet-based editing system.
Unique Browsers
The original JICREG concept for readerships was to relate survey results to the newspapers’ circulations and obtain ‘Readers per Copy’ (RPC) figures, both for all adults and demographic sub-groups. This approach provided five benefits:
-
- JICREG only accepted titles with audited circulation data, thus providing an independent foundation to the audience data.
- Once models had been developed for the RPCs they could be applied to un-researched titles of different sizes and in different locations
- Research did not have to be done continuously as the readerships could reflect change by applying the RPCs to changing circulation figures
- By collecting circulation breakdowns from the publishers the RPCs could be used to generate Post Code Sector level audiences. (There are c.9000 Post Code Sectors in Britain.)
- By using models for titles not undertaking research JICREG was able to provide a comprehensive readership currency for the whole medium.
The Portfolio Audience Project needed an equivalent to the circulation data for internet sites. It did not want to develop a stand- alone measure but preferred an independent source to use as the foundation for audiences, as it does with readerships.
In parallel to the work on the project, the advertising industry was in the process of agreeing ‘Unique Users’, subsequently renamed ‘Unique Browsers’ (UBs), as the benchmark. This metric is now audited by ABC Electronic and is available as a daily, weekly or monthly figure.
The PAG agreed to use monthly UBs as the foundation for the internet audiences. The decision to use monthly figures was driven by the fact that many sites within the MPD have small audiences and advertising campaigns on regional newspaper websites are usually sold on a minimum duration of one month.
The exact definition of UBs is complex but well documented on the ABC Electronic website. (www.abc.org.uk)
The use of audited UB data would provide the first three of the same benefits as circulation does for newspapers. However when this route was first investigated it became apparent that the cost of auditing every MPD website twice a year would be prohibitive.
After much discussion, a compromise was reached which was acceptable to both JICREG and the Newspaper Society. This was based on the fact that many sites owned by one publisher would use the same network and web analytics software.
The compromise involved three main points:
-
-
- Any site that was to be considered for JICREG would need to be registered with ABC Electronic as part of a publisher’s audited network.
- Any publisher who wanted their sites included on JICREG would need to have their top 10% largest sites (or top ten – whichever is the smaller), plus the network, audited every 6 months
- Publishers would agree to make available the data for any registered site for retrospective auditing at the request of JICREG. (This is only possible for sites registered in advance – hence point (a)).
-
This approach has been taken up by many of the larger publishing groups. (July-Dec 2008 included GMG, Johnston Press, Newsquest, Northcliffe & Trinity Mirror). More have joined since.
The Modelling Process
The technical details of the various models that comprise this project are described in the appendices. This section is designed to give an overview of the work that was done, the reasons for that work and a summary of the results that were obtained.
Initially it was envisaged that the data that would be used for the project would be that obtained from internet questions asked on the readership surveys for the related local newspapers. We collected this data from approximately 200 readership surveys and loaded this into a database for analysis.
However, it became apparent that the audience results from these recall questions bore little relationship to the data coming from the web analytic software. Also, in many cases the readership data that we had was several years old, and was therefore not appropriate for such a fast moving medium.
In 2007 Trinity Mirror tested a new approach to measuring their site audiences that was introduced by Survey Interactive (SI). Its methodology provides a way of estimating the adult audience, its profile and its regionality, calibrated to the UB figure. If this approach worked the group agreed that it would be much better data for the project to use.
Trinity Mirror shared the results of their test with the group and it was decided to put the modelling process on hold until data from their first full survey was available. In the meantime Northcliffe also asked SI to undertake research so the initial modelling was done using the data from these two projects.
Subsequently Johnston Press commissioned SI and the results of that data were then also incorporated.
Note:
It should be emphasised here that although JICREG has, to date, only used survey data from Survey Interactive it is equally open to internet research from other suppliers who meet the same criteria. (Just as JICREG uses readership research from several suppliers.) The SI approach uses a combination of logs from the web analytics software and a site specific survey. This allows SI to calibrate the findings to the UUB figures as well as to provide regional and demographic breakdowns of the audience.
While SI’s specific algorithms for doing the calibration are proprietary they have been appraised by independent technicians on behalf of JICREG.
We are already aware of at least two other research companies who provide similar research in other countries (Nielsen and Gemius). The important point here is not who the research company is but whether the research meets the industry’s requirements. JICREG will continue to review other suppliers and will accept data from any that meet equivalent criteria.
Five models have been developed in total. They are described below.
Unique Browsers conversion to All Adults
The UB metric is an estimate of the number of different devices used to access a particular website in a period. (Month)
Of course some people may access a site from several devices, e.g. from work and at home, and in contrast some devices may be used by more than one person to access a particular site, e.g. all the members of a family on the family PC.
The SI technique measures and adjusts for these issues and thus its core finding is the number of adults accessing the site.
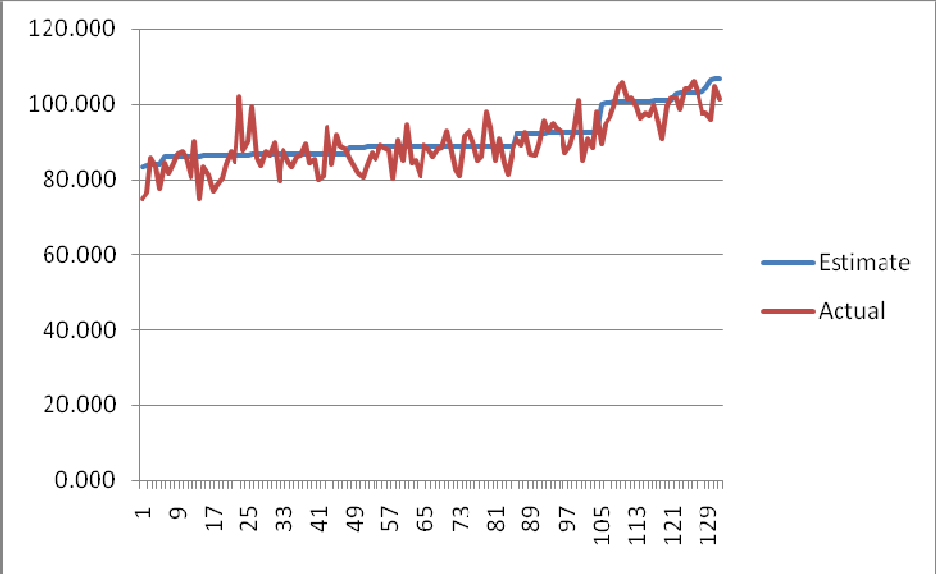
Obviously for sites which don’t have research a model is needed to be able to convert their UUB figures to an adult audience. Details of this model are shown in the appendix, but the following chart shows the comparison of the Index of Adults to UBs for the surveyed data (actual) compared to the modelled data (estimate).

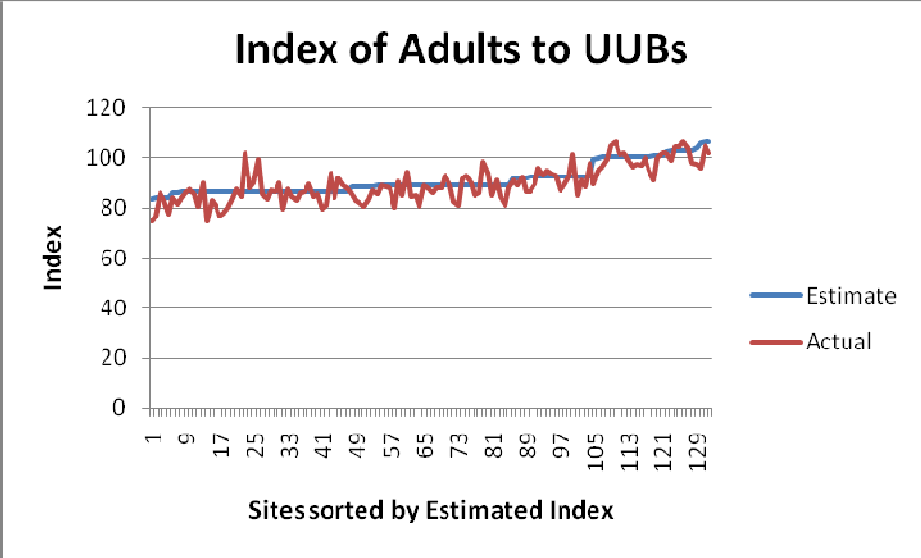
This chart illustrates two main points. Firstly, that the vast majority of sites index between 80 and 100 and secondly that the model reflects the main variation. Obviously with sample data one expects some variation around the estimate.
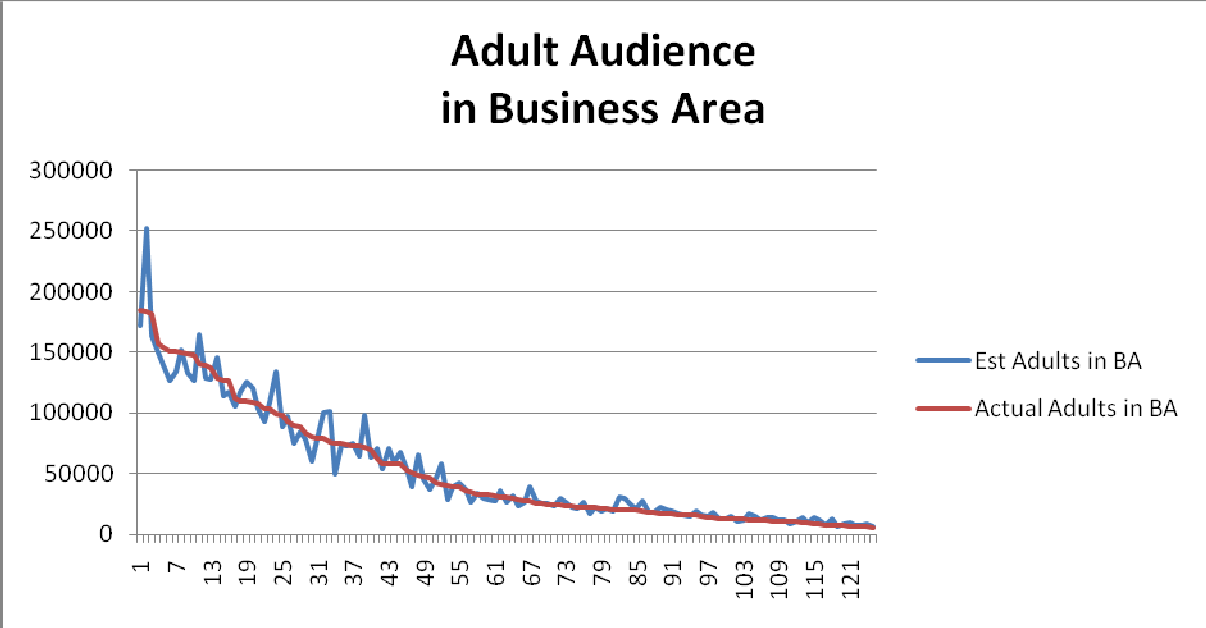
Adult Audience in the Business Area
A key aspect of the integration of internet audience data into JICREG is that the internet audience needs to break down regionally. In conjunction with the publishers and SI it has been agreed that the core area (business area) for each site would be the distribution area for its related newspapers. The link between newspapers and sites is established by the publishers when they enter the site details on to the MPD. The circulation areas for these are already held in the NS & JICREG databases.
The SI interactive research breaks out the audience data in three ways: outside GB; in GB; in the business area. (Other regional breakdowns are available dependent on sample size but these are the three used in this project.)
In order to be able to estimate the audience within the business area for sites without survey data a model has been developed that estimates the proportion of the total site audience within the business area.
This is a complex model the details of which are contained in the appendix, but it includes, for example, variables that relate to the presence of Premiership football clubs and the relative size of the readership of the related newspapers. This model, when combined with the first model allows us to estimate the adult audience within the business area. The following chart shows this estimate compared to the survey data (actual) for the sites included in the analysis.

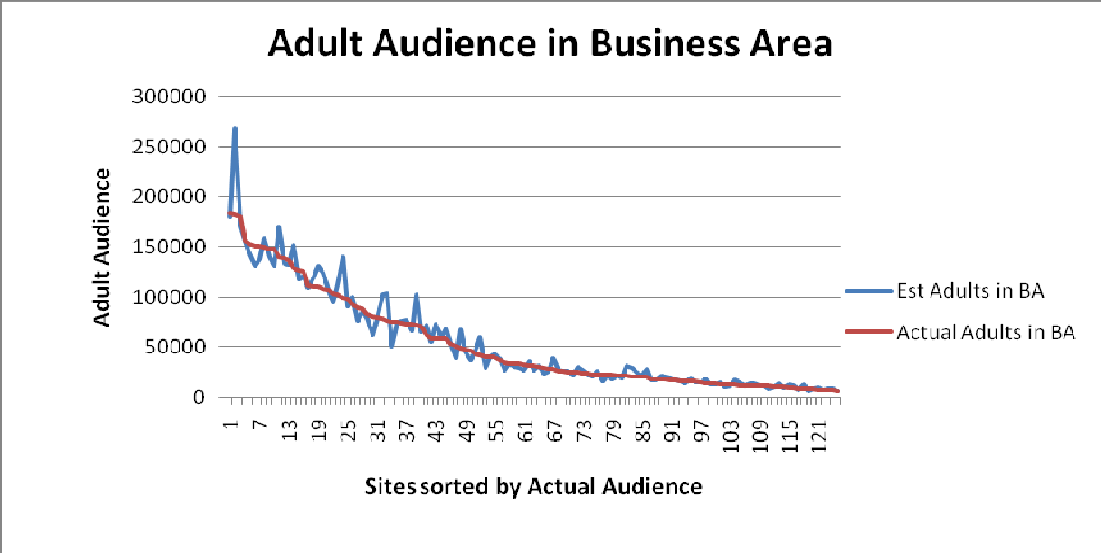
(Some sites for which we had SI data were excluded for numerous reasons which are all explained in the appendix. As an
example we excluded Northern Ireland sites as JICREG does not currently cover Northern Ireland).
As one would expect with sample data there are one or two outliers but in general the model is a very good fit. It is also encouraging that the outliers tend to be bigger sites that will probably have surveyed results rather than modelled on the database.
At this stage it is worth pointing out that JICREG agreed to have the models developed under the Portfolio Audience Project independently appraised by an independent statistician, Ken Baker. He has given a positive appraisal to first two models and a summary of his appraisal is included in the appendix.
Audience Profile
It was not possible to produce models for each of the 153 demographic sub-groups used by JICREG because the SI sample sizes do not permit that. What was done was to compare the three main demographic breaks (sex/age/class) profiles with the profiles of the related newspaper audiences. By using this approach we effectively take out the demographic variations between areas thus enabling us to combine data from different regions.
What this showed was that there were significant variations in the web site profile compared to the newspaper(s). The following average indices were calculated from the SI data:
Indices
| Website v newspaper | |
| Men | 86.7 |
| Women | 112.8 |
| 15-24 | 67.4 |
| 25-34 | 134.2 |
| 35-44 | 134.2 |
| 45-54 | 149.6 |
| 55-64 | 115.2 |
| 65+ | 36.3 |
| AB | 175.7 |
| C1 | 116.3 |
| C2 | 63.3 |
| DE | 80.8 |
-
- Daily and Weekly audience
While the main metric was originally agreed as monthly audience it has subsequently been accepted that for some larger sites weekly or even daily audience figures may be needed. In addition estimates for these will be needed in order to feed any reach accumulation formulae, as used by the third party bureaux which provide planning systems for the JICREG database.
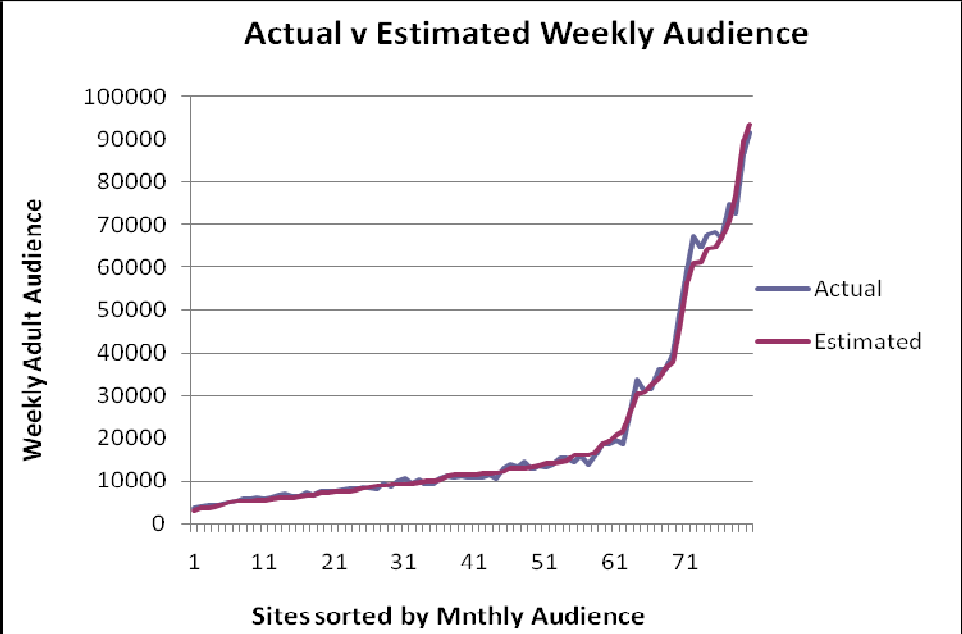
In the main it is expected that web sites will provide UBs for daily, weekly and monthly and then the monthly audience will be pro-rated as appropriate. However in some cases these data may not be provided so a model has been developed to estimate these from the monthly audience.
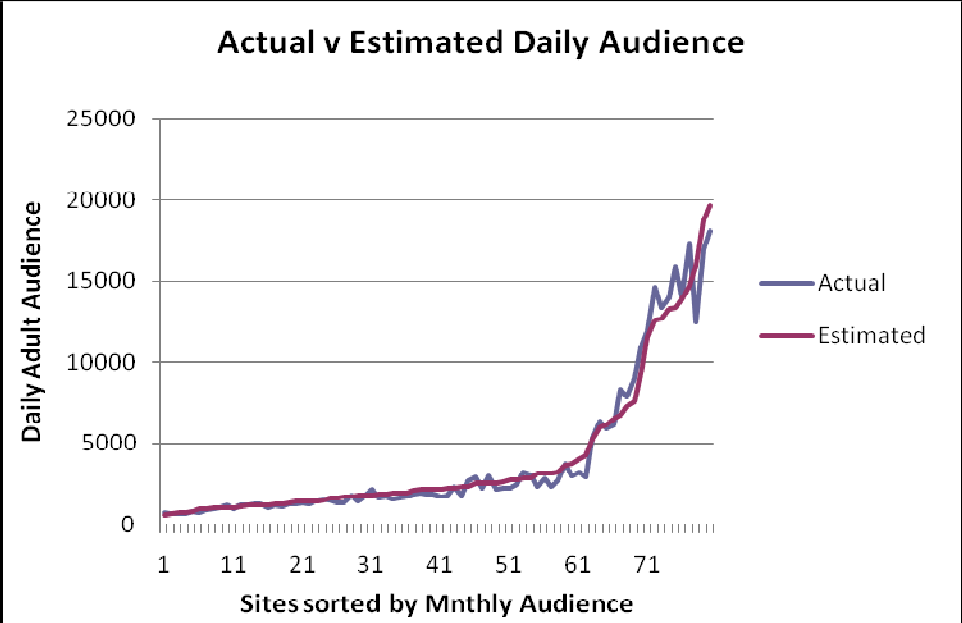
Details are in the appendix but the following graphs show how well the model works.
Weekly audience estimated from the Monthly Audience

Daily Audience estimated from the Monthly
Duplications
One of the most important aspects of measuring the internet audience is to be able to establish the combined audience of the web site and its related newspaper(s). In order to be able to do this we need to know the duplication of audience between the two.
It was agreed by the PAG that the main ‘Net Audience’ that was being used was the combination of the monthly web audience with the AIR of the newspaper(s). It is of course debatable as to whether different time periods should be missing but it is to some extent irrelevant since the planning systems will allow combinations of the two media for any time period.
So the model that has been developed for use with non-surveyed web sites is the duplication between Monthly web audience and AIR within the Business Area. (There can, by definition, be no duplication outside that area since it is defined as the circulation area of the newspaper(s)).
Experience has shown that the best way to model duplication is to in fact model the Index from Random. This is described as follows:
If a Web site has a monthly audience of X% And
A newspaper has an AIR of Y%
Then the Random Duplication R is (X * Y)/100 %
If we know from surveyed data that the actual duplication is Z% then the Index from Random is 100 * (Z/R)
(For example if X=30 and Y=20 then random duplication is (20*30)/100 % = 6%. If R=10% then the Index from Random is 100*(10/6) = 166.67 )
A model has been developed using the survey data that estimates this Index for the duplication between each website and its main related newspaper. Where web sites are associated with more than one newspaper we have to estimate the duplication for each individually as that is the way in which the duplications are used within JICREG – at an individual title level.
Since each title has a different distribution area it would have been a mammoth task to look at every duplication for every individual related newspaper. In addition the small sample sizes for many of the smaller titles would have introduced large sampling variation into the data being used. As can be seen from the following chart the model produced is extremely accurate at predicting the Index from random and this model will be used.

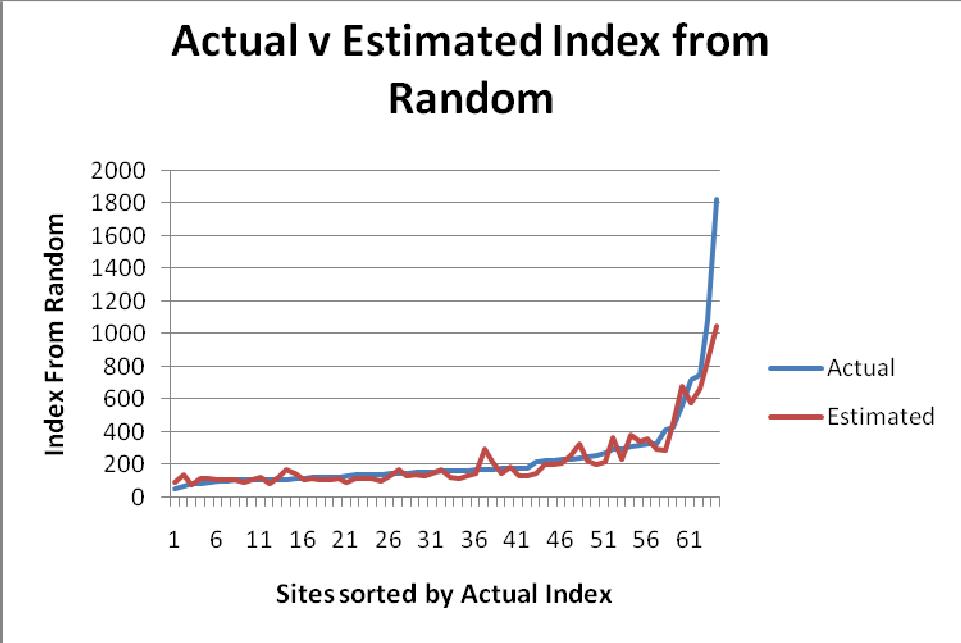
However as more data becomes available we will validate this model further by looking at both new data for main titles and also some secondary titles where sample sizes permit.
It is worth commenting on the last point on the graph which is not so well estimated. This is a site which has a monthly reach of only 1.3% and the newspaper AIR is also only 1.0%. With such small numbers the Index can vary enormously but will only reflect small variations in actual audience. In this case the actual estimated duplication was only out by 3,000 in a Business area of over 3,000,000.
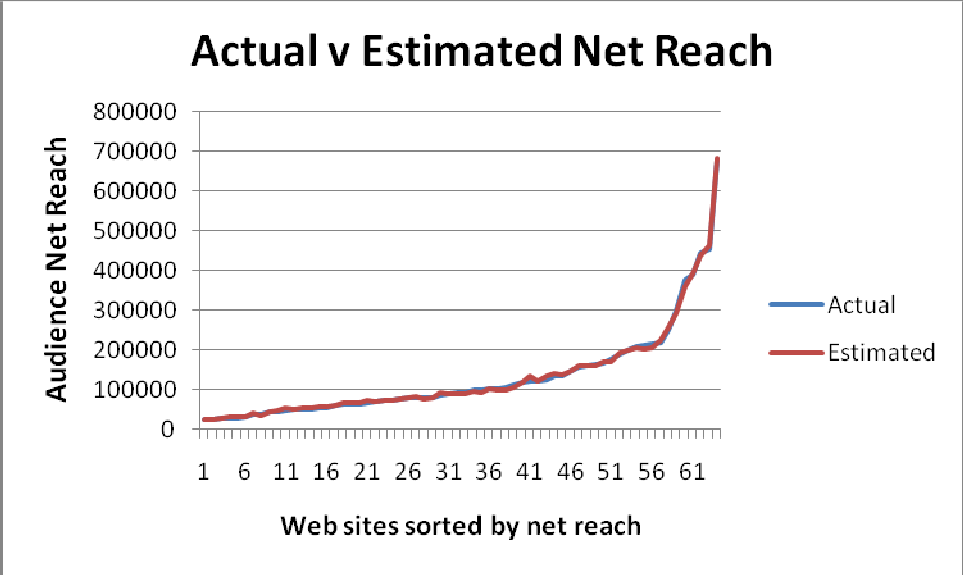
The chart below shows how well Net Reach of the website and newspaper is estimated using the modelled duplications. The average absolute error is 3% of the actual net reach.

Addition of actual survey based internet data to JICREG
As with newspaper audience research JICREG will include surveyed data on the JICREG database for sites that provide research using a methodology that is acceptable to JICREG. To this extent a ‘minimum requirements’ document has been issued to interested research companies (see appendix 3). So far only data from Survey Interactive has been submitted.
When submitted, survey data must quantify the internet audience and its profile, for the standard JICREG sub-demographics, within the business area of the site. In addition the audience duplication with the related newspapers, again within the business area, must also be included.
This data, in conjunction with the UUB figure that related to the period of the research, and details of the associated newspapers is then appraised by JICREG before being loaded into the database.
With newspapers JICREG requires all surveyed sites to be researched at least every three years. So far no such criterion has yet been formally agreed for web sites but it is anticipated that web sites should be researched more frequently, at least during this period of rapid growth.
Implementation of the models and survey data within JICREG
The JICREG database uses the MPD as the source for the list of web sites, its latest 6-monthly UUB count and the list of associated newspapers and their Business Areas. This will also tell JICREG whether the site has met the audit requirements that will allow the site onto JICREG.
If the site has approved survey data then this is loaded into the database. If not, modelled audiences are calculated. In both cases the audiences are for the total business area. Whether the data is surveyed or modelled it is then treated in the same way, as described below.
The audience in the business area is used to calculate ‘audience per UUB ratios’ for adults and all demographic sub-groups. (For surveyed sites this is done using the UUB at the time of the survey, for modelled sites the latest MPD UUB is used.)
Sample sizes for the majority of sites do not allow for analysis at a lower regionality than the business area. However the JICREG building block is the Post Code Sector. Analysis of the duplication between internet audiences and readership of the related newspapers shows there is a strong positive correlation between the two audiences.
We therefore decided to allocate the ‘within business area audience’ across post code sectors pro rata to the sector newspaper audience, while maintaining the internet audience profile. This then reflects both the sector level demographic variations and the relationship between web site and newspaper.
Implementation within the Planning Systems
The interface between JICREG and the planning systems essentially remains unchanged. Currently JICREG produces an interface file (a JRT file) which includes the relevant information for the planning systems.
A new specification for this file has been produced that includes the information for internet sites as well as newspapers. This has been distributed to the third party bureaux and will require some reprogramming by them. They have been asked to have this completed by the end of September.
Ongoing Updates to the database
The JICREG database will be updated every six months with the latest 6-monthly UUB data for those sites meeting the audit requirements outlined above. These data will reflect the periods January-June and July-December. Modelled audiences will be re-calculated and those with survey data will have their audiences pro-rated to the new UUBs
This method will ensure that the audience data is as current as possible.
Future Additional features
Once the initial system is released there will undoubtedly be need for change/enhancement. Some of the issues that we are already considering for later stages are:
- Inclusion of page view data, which is already collected on the Media Portfolio Database (MPD) and shown on MPD reports.
- Allocation of the out-of-area audience
- Adding cost information, again from the MPD
Appendices
-
- The models in detail
The exact coefficients of the models are the copyright of the NS which paid for the development work. The descriptions below therefore explain the processes, the variables that were used and the results graphically but do not give the final equations. This should not detract from the paper since the graphs illustrate the accuracy and the models are specific to the UK regional data.
Unique User conversion to Adults
The audited and unaudited Unique User counts relate to unique machines used to access the website in the relevant period. We need to convert this to Unique Adults visiting the website. Survey Interactive have developed a technique for doing this as part of their survey work. (Other companies are planning to do the same.)
This data has been analysed which revealed that there are differences in the ratio of Unique User counts and Estimated Unique Adult Users by site type, as is illustrated below
The conversion ratio of Unique Users to Unique Adults for these three types are shown below.
| Average for generic sites | 95.8 |
| Average for Classified sites (mainly recruitment) | 108.5 |
| National Sites | 103.2 |
The National sites are not part of this project and we do not yet have enough data on classified sites to provide separate models for these at this time; so both of these site types have been excluded from the modelling.
Using data provided by Northcliffe, Trinity Mirror and Johnston Press the following variables have been looked at in the modelling:
- The Unique User Count (in 000s)
- Region (Scotland)
- Site Group (see explanation below)
- Title Group
- Publisher
The resultant model is:
Adults = Constant + a * UUs + b * Scotland + c * SiteGroup + d * Title Group
+ e * Publisher X
Where
Apart from the Unique User count all the other variables take the value 1 or 0
Site Group means the ‘Site’ reported included more than one actual site (ie No. Subsites ) 1) Title Group means there is more than one associated newspaper (ie No. Titles > 1)
The model was based on 138 data points R-Squared for this model is 0.692
Comments on the model
- Several of the variables relate to where sites have been grouped together because the sample size for the individual sites was not large enough. It makes sense that these ‘sites’ behave differently. However on the NS database it is assumed sites will be displayed individually so these elements of the model will not be necessary and the model becomes simplified.
- For some reason there is a distinct difference in behaviour in Scotland. This may be because of the larger number of ex-pats who access Scottish sites. This is apparent across all the publishers with titles/sites in Scotland.
- There is one of the three data sets which has a different ‘level’ to its Adult conversion. This could well be because of a different design strategy for the particular publishers web-site or because of slight changes in the Survey Interactive procedures or indeed the use of different web-analytics system.. This needs to be reviewed as more data becomes available.
- The average absolute error in this model is only 3.2 percentage points.
- There are only two errors greater than 10 percentage points which will be investigated further.
The following graph shows the actual versus estimated for this model across the 138 data points
Index of Adults to Unique Users

Individual site data points
Adult Visitors – Estimation of % in the Business Area
In order to allocate internet audience regionally each website has to be linked to a business area. Since most sites are related to one or more regional newspapers the business area that has been used in the modelling is the circulation area of these newspapers.
The Survey Interactive (or equivalent) research provides a breakdown of a sites total audience and shows what audience is within the business area. These data for 140 sites have been used to produce a model that estimate the % of audience within the business area.
On analysing the data it became clear that sites such as The Scotsman and WalesOnline exhibit very different behaviour compared to ‘normal’ regional sites. Data for these has therefore been excluded from the modelling. (In addition two other sites
– for one town – show extreme behaviour and have been excluded until further checks can be made on the data for these sites.) In addition some further sites were excluded due to lack of JICREG data for the associated newspapers. This left 125 sites with data.
The following variables in the modelling:
-
- Number of associated newspapers
- Daily v Weekly associated title(s)
- Region (Scotland)
- Site Group
- Title Group
- The ratio of total web audience to AIR
- Premiership football cities The resultant model is:
% Audience in BA = Constant + a * No. Titles + b *Daily + c * Scotland
+ d * SiteGroup + e * Title Group + f * Web/Read Ratio + g * Football
Where:
Variables as above.
The model was based on 124 data point R-Squared for this model is 0.569
The chart below shows the comparison of actual versus estimated % audience.
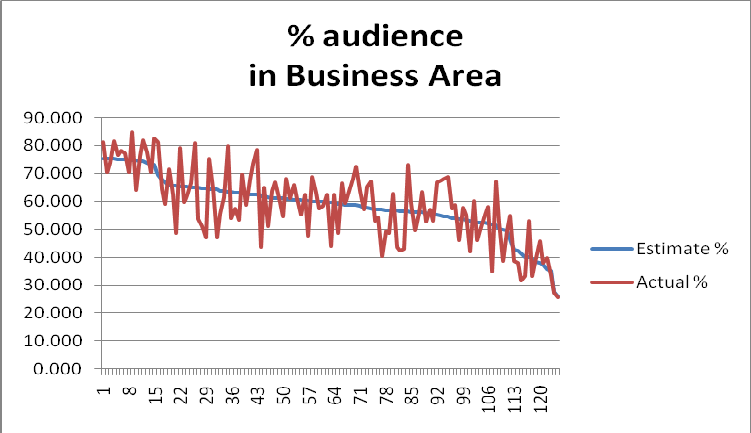
Individual Site data points
However the real comparison we need to make is the comparison of Actual Adult audience in the Business Area compared to the Estimated Adult audience – which results from the combination of the two models described above – and which will be the ‘currency’.
The following chart shows this comparison

Individual Site data points
As can be seen the combination of the two models provides a very good approximation to the Adult Audience in the Business Area, which is of course itself a survey finding and therefore subject to error. These two data sets have a correlation of 0.971
The Duplications
What are we modelling?
It was agreed by the PAG that the basic measure for internet audience would be the Monthly Adult audience, in the Business area.
The standard metric for the newspapers is the Average Issue Readership (AIR).
So the duplication that has been modelled is the duplication between Monthly internet audience and AIR. It is appreciated that this mixes metrics that cover different time periods but (a) this will not cause a problem within the JICREG system and (b) the Net Cover of Monthly Internet Audience and AIR is currently the most commonly used by the publishers.
Transformation to Index form
Duplications can vary enormously since they depend on various factors, in particular the size of each audience relative to the population. For example, if one audience is 100% (or near that) then the duplication must also be near or at 100%. Similarly if one audience is very small then the duplication must be also.
Years of experience show that the best way to work with duplications is to transform them into an ‘Index from Random’. That is to say how different is the duplication from what would have been expected if the two vehicles were randomly related. This transformation effectively takes out the size issues and shows the true relationship.
This transformation is simple as shown below.
If vehicle one has an audience of X% (of the population) and vehicle two has an audience of Y% then the random duplication is Z% where Z% = (X% * Y%)/100
Therefore if our duplication is D% of the population then the Index = 100 * D% / Z% An example numerically would be:
Vehicle one 30% audience; Vehicle two 15% audience Expected duplication (ie Random) = 15*30/100 = 4.5%
If the actual duplication is 9% then we have an index of 200
It is this Index that has been modelled, but obviously this can then be converted back to an actual duplication by reversing the above process.
The data used
The model for duplications has to be done at the individual site/newspaper level. Therefore those ‘sites’ that were in fact combinations of sites were excluded from this process.
Also, the duplications required special analysis of the Survey Interactive databases in order to tabulate each individual site against each individual newspaper – within the newspaper circulation area. Analyses were done on the Trinity and Johnston Press data but not yet on Northcliffe data.
Where web sites were associated with more than one newspaper the duplication with the main newspapers has been looked at. The relationship needs to be checked to see if it holds true for the smaller associated titles .
The model
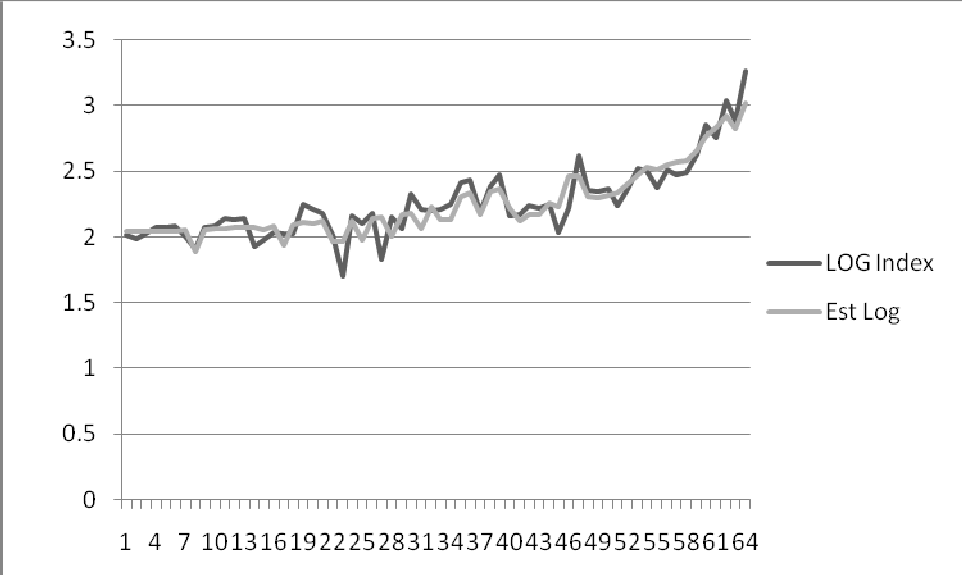
The model arrived at is in fact a model of the Log (base 10) of the index. This further transformation was made as it provided a much improved model. The model equation is:
Log(Index) = Constant1 + a * Population + b * Weekly
+ c * ((Constant2-AIR proportion) ^ d)
Where:
Population is the population of the Business Area (circulation area of the newspaper) in 000s Weekly is a binary variable (0/1) to indicate whether the newspaper is a weekly
AIR proportion is the AIR as a proportion of the population (range 0.0 – 1.0)
As you can see from the following graphs the model is a very close fit both when looking at the Log Index function and also when this is converted back to duplication.


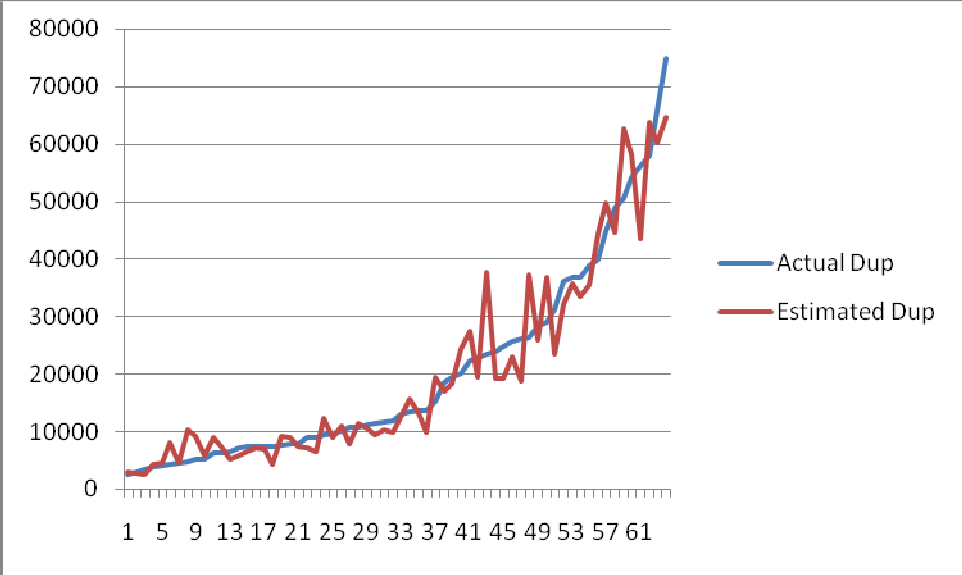
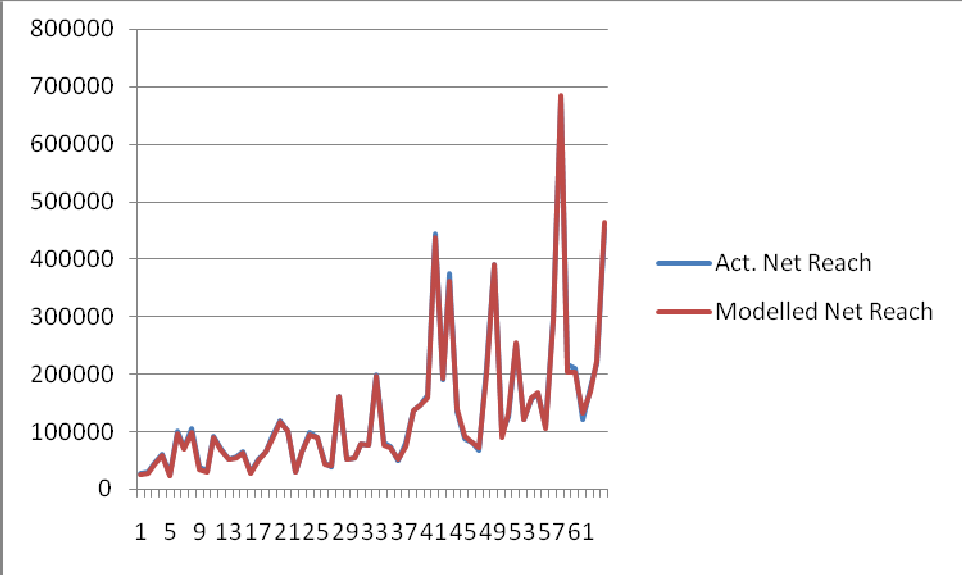
However the duplication is not important in itself. What we really want to know is how close is the estimate for the Net Reach for the internet and newspaper combined. This is shown in the following chart (same site order as previous chart) where it is extremely difficult to separate the two lines.

Overall Modelling
The chart above illustrates that the duplication modelling is as accurate as is needed for the purposes, but the above chart while accurately reflecting the duplication model accuracy is a bit misleading since it is based on the surveyed web audience, in combination with the JICREG newspaper AIR.
The real proof is when we use the modelled web audience with the JICREG newspaper audience and the modelled duplication.
The chart below shows this comparison. Unfortunately it does not have quite as many sites because the initial web audience modelling was based on gross population areas for those sites which had multiple newspapers associated. The following chart therefore only includes those sites where all three stages of the modelling were done on the same population area.

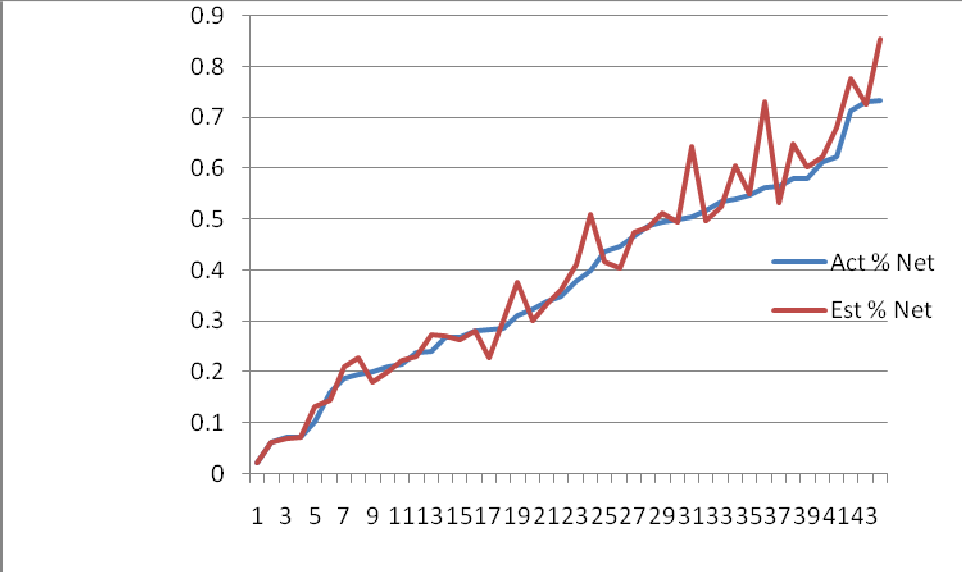
Considering that the above estimate is based on the combination of three separate models (UUBs to Adults; Adults in the Business Area and Duplication) it appears to be a remarkably good fit.
There are three or four outliers which need to be investigated further. The majority of the difference in each of these comes from the estimate of the audience in the Business Area model and is not caused by the duplication model.
Although there is more work to be done to refine all the models, and this will become easier as more, new data becomes available, the evidence from the graph above warrants the use of the current models in the initial launch.
Ken Baker appraisal
JICREG asked Ken Baker, an independent statistical consultant, to appraise the work undertaken by Richard Dodson on behalf of the Newspaper Society. These are his conclusions.
BACKGROUND
The Newspaper Society commissioned Richard Dodson (Telmar Europe Ltd) to develop models whereby the audience of the web sites relating to regional newspapers could be added to the JICREG database. Two models were presented to Ken Baker for appraisal.
-
-
- A model estimating the Adult audience to the websites.
- A model estimating the % of the Adult audience which is within the distribution area of the related newspaper.
-
It is not necessary in this paper to reproduce the full appraisal which will be available from JICREG in due course. However the summary and conclusions are repeated below.
SUMMARY and CONCLUSIONS
- Both models reveal a high degree of accuracy.
- On average the model converting Unique Users to adults will be accurate on average to within 4% of the estimate.
- The collected data for % adults is more variable, and on average applying both models if only UU’s are known ,the number of adults in the business area will be accurate on average to 13% of the estimate.
- Both models have clearly been built with close examination of the residual errors, and much ingenuity has been shown in improving the model via presenting the predictor variables in their current form and determining the predictor variables.
Requirements for Research Companies Research requirements
The main objectives of this project are
- To establish internet audience levels and profiles for regional newspaper websites.
- To incorporate internet audience data onto Jic-in-a-box as the reporting system.
- To establish the duplication between the internet audience and the newspaper readership to enable reach and frequency analysis to be undertaken.
Unique users/browsers as audited by ABCE reflects access points rather than people and does not take into account multiple access points, cookie deletion etc. which can lead to people being counted twice and makes it virtually impossible to establish demographic profiles. As a result it is important to establish the number and social grade of people accessing websites. However, it is also recognised that normal face-to-face research methods are not necessarily very accurate at measuring website audiences as people do not necessarily know which websites they have visited.
Internet based research may provide a more reliable method of measuring website audiences as it enables actual usage rather than claimed usage to be measured, but a number of factors need to be taken into consideration:
- There is no control over the research area so it is important to identify where respondents live to enable total audience, UK audience, and local area audience to be established.
- It only measures people who do use the website and does not measure people who don’t use the website.
- A methodology needs to be developed linking audience (people) to unique user visitor counts so that the total audience can be established. This is crucial to enable the audience to be adjusted as the unique user figure changes, similar to applying the RPC to latest circulation figures as currently happens with newspapers.
- Any research methodology would need to be independently assessed before the results could be approved.
- Readership of all related regional newspapers would need to be established, and any newspaper questions must be asked in the standard JICREG.
JICREG would require at least the following data to be submitted from any regional newspaper website research:
- Website net audience for 1 week, and 1 month
- Net audience broken down by standard JICREG demographics
- Total website audience
- UK website audience
- Local website audience
- Definition of local website area by postcode sector.
- Readership duplication between website and all related regional newspapers