Rebecca McPheters, McPheters & Company
Dr. Scott McDonald, Condé Nast Publications
Worldwide Readership Research Symposium Valencia 2009 Session 3.1
Background
Incidence of usage and time spent by medium have been measured in different ways by a variety of sourcesi over an extended period. In some cases, media have been measured individually, while other studies have measured usage across multiple media. Recently, the on-going analysis of data from the Middletown Media Studies has brought renewed attention to the issue of time spent. However, the major trends remain essentially the same regardless of data source.
- Television continues to offer near universal reach and to garner the largest share of media time. Time spent with television has increased as an ever widening array of channels, programming and viewing options have become available; in November of last year, Nielsen reported that television usage at the household level was the highest of any time since they commenced measuring television audiences in the 1950s, with an average time spent of about 33 hours per weekii.
- While 25-30% of the population has yet to be reached by the Internetiii, the time spent per user is substantial and continues to grow. Current Nielsen estimates indicate that average Internet usage is in excess of 6 hours a weekii – of which more than a quarter (28.6%iv) is spent on communications such as email and instant messaging.
- Time spent with magazines is estimated at slightly under two hours a weekv – a fraction of the time spent with these other media – and has remained relatively consistentvi over time. According to MRIvii, 83% of the population reads magazines.
Because of the growth in time spent online, some – including the Online Publishers Association – have suggested that advertisers should change their media allocations to reflect the proportion of time spent with each medium. The idea that time spent is an appropriate basis for media allocations is fundamentally flawed, because it fails to reflect real and substantial differences in:
- The rates at which differing media deliver ad impressions
- The extent to which delivered impressions are actually exposed
- The ability of an exposure to effectively deliver an advertising message; i.e. ad absorption
- The cost per effective exposure
To better understand these variables, Condé Nast teamed with McPheters & Company and started doing pilot work in this area in early 2008. Subsequently, Dave Poltrack, Chief Research Officer, CBS Corporation, joined in our collaboration. The resultant study used McPheters’ AdWorks™ methodology and was fielded in the state-of-the-art CBS Television City facilities at the MGM Grand in Las Vegas.
While partial findings were presented earlier this year at the annual conference of the Advertising Research Foundation, the nature of the data produced by the study opened up a number of opportunities for further analysis beyond those originally envisioned, including insights into how magazines and the Internet are consumed and an improved understanding of some of the factors which contribute to ad effectiveness. Of particular note is the fact that further exploration of costs and television commercial exposure have caused us to revise some of our earlier estimates and to extend our analysis to include estimates of differential costs.
The AdWorks™ Intermedia Effectiveness Lab
Measuring Ad Absorption
Our primary goal was to comparably measure effectiveness of ads which were exposed via three separate media: television, the Internet, and magazines. Three hundred respondents, 100 for each of the three media, were recruited to spend a half hour consuming a single medium.
To qualify for inclusion in the study respondents had to be regular users of the medium to which they were exposed and spend at least 5 hours a week watching television, 5 hours a week surfing the Internet or 1 hour a week reading magazines. Each cell of 100 was further broken down into 4 demographic cells of 25 each, including one each for Men 18-34, Women 18-34, Men 35-54 and Women 35-54. Respondents spent a half hour either:
- Watching their choice of 6 popular sit-coms
- Reading one of 10 magazines, including both weekly and monthly titles and a range of genres targeting male, female, and dual audiences
- Surfing the Internet as they would normally, except that they were asked not to check email
At the end of each half hour, similar surveys were administered online to all respondents and they were asked if they recalled seeing each of 8 ads: 4 that appeared in the medium to which they were exposed and 4 that did not. This method of measuring and adjusting for false claiming was first used by W.R. Simmons in a study conducted in 1965 under the auspices of the ARF. For television, we measured 30-second ads, for magazines, full-page ads and for the Internet, we measured typical banner ads – including leaderboards, skyscrapers and rectangles. We defined ad absorption or net recall as the percent recall of ads to which respondents were exposed minus the percent incorrect recall of those ads to which they were not exposed.
In addition to recall, information was also collected on unaided recall, product and category usage, media habits and demographics.
Measuring Ad Exposure
For television and the Internet, respondents had a 100% opportunity to see the test ads. Television viewers watched the entire program they selected and did not have fast-forward capabilities, nor could they leave the room during commercial breaks. In this respect, our laboratory exercise may overstate the probability of TV ad exposures per 30-minute interval since it is well established by other research that many TV viewers use commercial breaks to do activities, leave the room, or otherwise reduce their attention to the screen. Rather than make arbitrary adjustments to accommodate situations outside of the laboratory, we assume 100% OTS for the TV test ads, and suggest that others applying the logic of this work make their own adjustments based on their own assessment of the research on viewer behavior during commercial breaks, use of DVRs, and related factors. No such issue arises for the Internet exposures since the ads served to the pages visited in the lab are assumed to be the same as those that would be seen if those pages had been visited on the users’ own home or work computers. Surveys for web surfers were personalized to each respondent based on the ads to which they were exposed. For magazine readers, the probability of exposure was high, but less than 100%. To determine whether the magazine test ads were actually exposed, each magazine session was taped in high resolution and viewed independently by two analysts to ascertain which test ads were exposed. In the few cases were there were differences, tapes were reviewed by a third analyst.
For Internet Only: Results of Eye-Tracking
Thirty-two of the Internet sessions, evenly split across the four demographic cells, were conducted on a computer fitted with eye-tracking software. These sessions were subjected to separate analysis to determine:
- Sites visited
- Ad supported
- Non-ad supported
- How many ads appeared
- Whether the ads appeared in full
- Whether the ad was seen
- Passively (eyes passed over ad)
- Actively (eyes stopped on ad)
- Whether the respondent clicked through
Additionally, analysts worked with the tapes to revisit the same sites and explore whether there were ads appearing below the area to which the respondent was exposed; we refer to these as areas below the scroll.
What We Learned
Ad Exposure & Recall
In the 30-minute sessions, magazine readers were exposed to an average of 65 ads – twice as many as Internet usersviii, who were exposed to 28, and four times as many as TV Viewers, who were exposed to only 16.
Gross recall of test ads was significantly higher for television than for the other media. Incorrect recall was highest for Internet advertising and lowest for magazines. The ad absorption rate or net recall for television was twice that of magazine ads, which were in turn three times that of the Internet.
Ad Exposure & Recall by Medium
| Ads
Exposed |
Recall of
Exposed Ads |
Incorrect
Recall |
Ad Absorption
or Net Recall |
Net Ads
Recalled |
|
| Television | 16 | 78.6% | 6.5% | 72.1% | 12 |
| Internet | 28 | 22.0% | 8.4% | 13.6% | 4 |
| Magazines | 65 | 39.9% | 2.4% | 37.5% | 24 |
Across the television programs the recall scores fell within a relatively narrow band. The ranges were much broader among magazines – though for some of the titles measured there were too few respondents to draw meaningful conclusions. Unaided recall was much higher for television and magazines where the number of brands recalled were about the same – 2.1 and 1.9 respectively – than it was for Internet advertising where the number of brands recalled was .5. While we had expected to find a correlation between recall and product usage, we did not – perhaps because of the diversity of the product categories represented.
Magazine Ad Exposure & Behaviors
The videotapes of respondents reading magazines provided an opportunity for us to actually observe how readers approach magazine reading. We found that the overwhelming majority – 73% – of magazine readers read from front to back. Less than one in five (18%) anchored their reading with the Table of Contents, 8% flipped back and forth, and only 1% read from back to front. Respondents were exposed to an average of 77.7% of the pages. However, because ads most frequently are placed in the front of the book, 84% of test ads were exposed. Women over 35 were exposed to the highest proportion of both pages and ads. It should be noted that while we allowed respondents to read for only 30 minutes, according to MRI the average reading time for magazines they measure is significantly longer – about 43 minutesvii.
Probability of Page and Ad Exposure
| Exposure | F18-34 | F35-54 | M18-34 | M35-54 | Total |
| % Pages | 74.1% | 81.7% | 75.3% | 79.6% | 77.7% |
| % Test Ads | 84.0% | 87.0% | 82.0% | 83.0% | 84.0% |
Not surprisingly, the proportion of pages read had an inverse correlation with the total number of pages. However, there was no correlation between recall of exposed ads and page count. While MRI does not report number of reading occasions, among the titles measured Average Page Exposure – which is a function of reading days, number of issues opened, and % of pages read – tends to be higher for those publications with higher page counts.
The disparities between recall by title were substantial, with net recall ranging from a high of 64.3% to a low of 20.2%. In an effort to better understand what was driving these differences, we coded each magazine/ad exposure based on whether the ad was aligned with the magazine’s content – for example travel ads in a travel magazine, ads with sports-related endorsements in a sports magazine, or entertainment ads or ads with celebrity endorsements in a celebrity title. Indeed, we found that ads that were aligned with the content of the publication generated net recall almost twice that of unaligned ads.
Magazine Recall: Aligned vs. Unaligned
| Aligned | Unaligned | |
| Gross Recall | 45.5% | 25.8% |
| Net Recall | 43.1% | 23.4% |
We wondered whether standard measures of engagement may explain some of the variation in recall by title as well. In an attempt to answer this question, we attempted to correlate recall by title with engagement measures of MRI and Simmons’ Multi-Media Engagement Study for each magazine. Information was available for 9 of our 10 measured titles. The largest positive correlation was provided by the Simmon’s metric “trustworthy” (.18), followed by their measure of “ad receptivity” (.13). Neither was statistically significant.
Among magazine readers, gross recall was highest for entertainment, travel and consumer packaged goods advertising. Recall was lowest for high-ticket hard goods, such as computers, automotive and watches – perhaps reflecting the economic conditions at the time of our fieldwork.
Gross Recall by Ad Category
| Ad Category | # of
Exp. |
F18-34 | F35-54 | M18-34 | M35-54 | Total |
| Automotive | 49 | 22.2% | 0.0% | 41.7% | 30.8% | 22.4% |
| Computers | 26 | 16.7% | 9.1% | 16.7% | 33.3% | 15.4% |
| Corporate Awareness | 16 | 0.0% | 30.0% | 33.3% | 0.0% | 25.0% |
| Consumer Packaged Goods | 31 | 46.2% | 85.7% | 33.3% | 62.5% | 58.1% |
| Cosmetics | 36 | 36.4% | 36.4% | 0.0% | 0.0% | 33.3% |
| Entertainment | 29 | 71.4% | 92.3% | 50.0% | 33.3% | 72.4% |
| Fashion | 27 | 41.7% | 20.0% | 33.3% | 0.0% | 29.6% |
| Finance | 25 | 0.0% | 33.3% | 37.5% | 70.0% | 44.0% |
| Liquor/Wine | 13 | N/A | 0.0% | 42.9% | 60.0% | 46.2% |
| Tea | 22 | 0.0% | 0.0% | 44.4% | 44.4% | 36.4% |
| Travel | 16 | 60.0% | 50.0% | 100.0% | 50.0% | 62.5% |
| Watches | 32 | 25.0% | 25.0% | 55.6% | 33.3% | 37.5% |
| All Others | 14 | N/A | N/A | 55.6% | 80.0% | 64.3% |
| All Categories | 336 | 36.9% | 35.6% | 43.9% | 43.4% | 39.9% |
Alignment appears to have generated substantial lifts in recall for advertising in the consumer packaged goods, cosmetics and fashion categories.
Gross Recall by Ad Category: Aligned vs. Unaligned
| Ad Category | Aligned | Unaligned | Total |
| Automotive | N/A | 22.4% | 22.4% |
| Computers | N/A | 15.4% | 15.4% |
| Corporate Awareness | N/A | 25.0% | 25.0% |
| Consumer Packaged Goods | 68.8% | 46.7% | 58.1% |
| Cosmetics | 39.3% | 12.5% | 33.3% |
| Entertainment | 72.4% | N/A | 72.4% |
| Fashion | 31.8% | 20.0% | 29.6% |
| Finance | N/A | 44.0% | 44.0% |
| Liquor/Wine | 33.3% | 50.0% | 46.2% |
| Tea | 36.4% | N/A | 36.4% |
| Travel | 62.5% | N/A | 62.5% |
| Watches | N/A | 37.5% | 37.5% |
| All Others | 40.0% | 77.8% | 64.3% |
| All Categories | 50.4% | 32.3% | 39.9% |
Internet Ad Exposure & Behaviors
Our detailed analysis of the Internet sessions with eye-tracking software showed that 44% of the websites visited were not supported by advertising. However, on average visits to the ad-supported sites lasted slightly over three minutes while those to non-ad supported sites lasted less than two minutes. In aggregate about 70% of respondent time was spent on ad-supported sites.
Internet Banner Ads
Our other findings in regard to banner ads included:
- 10% of ads fell below the scroll – and hence did not appear on-screen
- Women were exposed to a higher proportion of ads served than men – 93% vs. 87%
- The brand could not be identified for 5% of the ads served
- 14% of the ads served did not appear in full
- Only 74% of the ads served were both fully displayed and identifiable by brand
Our analysis of the eye-tracking data found that 37% of the ads served were seen either actively or passively by respondents – while their eyes stopped on 32% of the ads. The click-through rate was 1%. Based on the ads served, only 11.5% of ads were recalled.
Internet Video Ads
While we did not measure recall of video ads, we did analyze the eye-tracking tapes to determine the incidence with which they were seen. Video ads were much more likely to actually be seen than banner ads, with 67.4% seen either actively or passively, and most of these were actively seen (i.e. respondents’ eyes stopped on 60.5% of the video ads). Respondents saw an average of
1.3 video ads per half hour, and men were exposed to more than 3 times as many video ads as women (2.1 vs. .6).
Further Analysis of Internet Ads
Subsequent to the original release of our findings at the ARF conference in March 2009, Condé Nast underwrote an expanded analysis of the recall data for online advertsing, including not only the eye-tracking tapes, but the tapes for the remaining Internet sessions. In this expanded analysis, we related each test ad for which we measured recall to the specific website on which it appeared and categorized the websites. We also counted the number of ad exposures for each respondent and windows open at the time of exposure. Here are the findings:
Gross Recall by Type of Website
There were major differences in recall by type of site, with social networking and shopping sites performing best and portal or search sites performing most poorly.
Gross Recall by Type of Website
| Site Type | # of Ads | F18-34 | F35-54 | M18-34 | M35-54 | Total |
| Social Network | 18 | 33.3% | 0.0% | 25.0% | 75.0% | 38.9% |
| Shopping | 32 | 37.5% | 33.3% | 20.0% | 40.0% | 34.4% |
| Food | 14 | 33.3% | 33.3% | 0.0% | N/A | 28.6% |
| Weather | 15 | 0.0% | 20.0% | 50.0% | 40.0% | 26.7% |
| Sports | 41 | 50.0% | 16.7% | 28.0% | 0.0% | 24.4% |
| Entertainment | 98 | 25.0% | 23.8% | 18.2% | 10.5% | 20.4% |
| News & Politics | 106 | 18.8% | 12.9% | 29.4% | 14.3% | 17.0% |
| Search/Portal | 23 | 0.0% | 0.0% | 16.7% | 0.0% | 4.3% |
| All Others | 45 | 25.0% | 50.0% | 17.6% | 0.0% | 26.7% |
| All Websites | 392 | 25.0% | 22.9% | 23.0% | 17.7% | 22.2% |
Gross Recall by Ad Category
Recall is highest for entertainment ads (38.2%) and lowest for automotive ads (11.9%). Interestingly, while food websites performed well, food ads did not.
Gross Recall by Ad Category
| Ad Category | # of Ads | F18-34 | F35-54 | M18-34 | M35-54 | Total |
| Entertainment | 34 | 40.0% | 20.0% | 54.5% | 25.0% | 38.2% |
| Telecom | 45 | 33.3% | 42.9% | 41.7% | 21.4% | 33.3% |
| Other Packaged Goods | 11 | 25.0% | 0.0% | 50.0% | 50.0% | 27.3% |
| Healthcare | 13 | 33.3% | 20.0% | 50.0% | 0.0% | 23.1% |
| Financial Services | 54 | 50.0% | 14.3% | 14.3% | 22.2% | 22.2% |
| Packaged Food | 25 | 18.2% | 60.0% | 0.0% | 0.0% | 20.0% |
| Travel | 36 | 0.0% | 36.4% | 25.0% | 25.0% | 19.4% |
| Consumer Electronics | 30 | 50.0% | 10.0% | 10.0% | 12.5% | 13.3% |
| Retail | 41 | 16.7% | 9.1% | 16.7% | 0.0% | 12.2% |
| Auto | 42 | 0.0% | 20.0% | 7.1% | 16.7% | 11.9% |
| All Others | 61 | 31.6% | 26.7% | 20.0% | 16.7% | 24.6% |
| All Categories | 392 | 25.0% | 22.9% | 23.0% | 17.7% | 22.2% |
Aligned vs. Unaligned Recall by Type of Website
Ads that appeared on websites with related content – for example, food ads on food sites and entertainment ads on entertainment sites – had substantially higher recall than ads running on sites with unrelated content. Overall, contextually aligned ads had gross recall of 31.7% vs. only 19.7% for unaligned ads. When adjusted for incorrect recall, aligned ads generated more than twice the recall of unaligned ads, with net recall of 23.3% vs. 11.3%.
Gross Recall by Type of Website: Aligned vs. Unaligned Ads
| Site Type | Aligned | Unaligned | Total |
| Entertainment | 47.1% | 14.8% | 20.4% |
| Food | 44.4% | 0.0% | 28.6% |
| News & Politics | 25.0% | 16.7% | 17.0% |
| Search/Portal | 0.0% | 4.5% | 4.3% |
| Shopping | 30.0% | 36.4% | 34.4% |
| Social Network | 50.0% | 35.7% | 38.9% |
| Sports | 18.8% | 28.0% | 24.4% |
| Weather | 100.0% | 21.4% | 26.7% |
| All Others | 20.0% | 32.0% | 26.7% |
| All Websites | 31.7% | 19.7% | 22.2% |
As we did for magazines, we attempted to correlate recall by type of website with Simmons’ engagement metrics. While the data were slightly more robust, we still failed to find significant differences. The strongest positive correlations were with “Personal Timeout” (.22) and “Social Interaction” (.19).
Aligned vs. Unaligned Recall by Ad Category
Food ads performed better than non-food ads on food websites (chart above), and performed better on food sites than non-food sites (chart below). While ads for entertainment performed better than other ads on entertainment sites, entertainment ads also performed well on other types of sites.
Gross Recall by Ad Category: Aligned vs. Unaligned Ads
| Ad Category | Aligned | Unaligned | Total |
| Auto | 0.0% | 12.5% | 11.9% |
| Consumer Electronics | 0.0% | 17.4% | 13.3% |
| Entertainment | 34.6% | 50.0% | 38.2% |
| Financial Services | 33.3% | 21.6% | 22.2% |
| Healthcare | 0.0% | 25.0% | 23.1% |
| Other Packaged Goods | N/A | 27.3% | 27.3% |
| Packaged Food | 50.0% | 5.9% | 20.0% |
| Retail | 25.0% | 9.1% | 12.2% |
| Telecom | 25.0% | 34.1% | 33.3% |
| Travel | 12.5% | 21.4% | 19.4% |
| All Others | 53.3% | 15.2% | 24.6% |
| All Categories | 31.7% | 19.7% | 22.2% |
“Old” vs. “New” Media
There was no meaningful difference in recall between ads running on “traditional” media sites and those running on “new media” sites – with gross recall of new media sites at 22.3% vs. 22.1% for traditional media sites.
Correlation of Net Recall to Number of Ad Exposures
Our earlier analysis had suggested a negative correlation between the total number of ads exposed and net recall at the respondent level. The expanded data set lets us confirm this correlation as statistically significant for the entire sample, as well as for the 18-34 age group and the M18-34 demographic cell.


Correlation Between Net Recall & Number of Ad Exposures
| 18-34 35-54 | Total | |||
| Women
Men |
-8.8% -17.3%
-30.0% -0.4% |
-13.7%
-16.4% |
||
| Total | -18.5% -14.4% | -16.4% |
Recall by Windows Open
Finally, we examined whether multiple open browser windows at the time of ad exposure had any impact on recall. Interestingly, having multiple windows open leads to decreased recall for men but increased recall for women.
Recall & Number of Windows Open
| Browser Windows | F18-34 | F35-54 | M18-34 | M35-54 | Total |
| Multiple | 27.3% | 34.8% | 16.0% | 6.5% | 19.8% |
| Single | 24.4% | 19.2% | 25.3% | 23.1% | 23.0% |
Relative Value and Implications for Media Planning
This work has direct implications for the ways in which media are planned and can be used as a basis for improving media allocations. By allocating media spending based on the relative cost per effective exposure among the population being targeted, greater advertising impact can be generated without increasing budgets. The process starts with similarly sized measured audiences, which are then multiplied by the probabilities of both exposure and effectiveness to yield the number of effective exposures.
X X =
Measured Audience
Probability of Exposure
Probability of Effectiveness
Effective Exposures
If we apply what we’ve learned and use accepted currency measures to fill the gaps, we can establish the relative values, on average, of ads in each of the three media we measured. So for example by starting with a measured audience of 1000 for each medium, we can calculate comparable levels of effective exposure. The recent introduction of the new C3 currency measure for television – the rating for the average commercial minute in live programming plus three days of digital video recorder playback
– brings the probability that the audience will be exposed much closer to 1. In our preliminary findings we assumed it was one – and were promptly informed of our error. We have since lowered our estimate to 92.7%ix. For magazines, we assumed that the probability of exposure is equal to the Average Page Exposure for the magazines measured as reported by MRI. Average Page Exposure reflects the fact that an average reader reads a single issue on multiple occasions and thus has more than one opportunity to see the ads in that issue. We are not aware of any similar measures for the Internet and have used our AdWorks™ exposure rate of 85% for Internet ads. For all media, the probability of effectiveness is based on our lab results for absorption for exposed ads.
Relative Ad Value by Medium
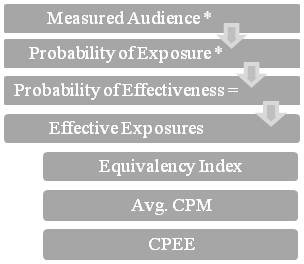
By taking as our basis a 30-second TV ad and assigning it an Equivalency Index of 100, we can then determine that a magazine page has an Equivalency Index of 90 and an Internet banner ad an Equivalency Index of 17.
Lastly, we wanted to apply what we had learned to the costs of the different media. Regardless of medium the costs charged for advertising are highly variable – and, in truth, known only by the agency and the media owner. However, Ed Papazian regularly estimates CPMs by medium – which we used as the basis for our own estimates of Cost per Effective Exposure or CPEE. We should point out that the costs of online advertising we used are his estimates for “large banner ads”, which are consistent with the formats we measured.
Conclusions
The results of our study lead us to conclude that:
- Consumer time spent with a medium, per se, is not a useful basis for making media allocations. Indeed, the three media differ widely in their rate of ad delivery and in the effectiveness of their ad delivery.
- Recall of television ads is substantially higher than that of magazine ads, but far fewer are delivered per hour
- Recall of magazine ads is much higher than that of Internet ads
- Magazines effectively deliver more ads in less time than TV or the Internet
- Only 73% of Internet banner ads served appear onscreen and are identifiable by brand
- Only 11.5% of Internet banner ads served are recalled
When ads for each medium are delivered to audiences of the same size, a full-page 4-color magazine ad is 90% as effective as a 30-second TV ad and an Internet banner ad is 17% as effective. We estimate that the corresponding Cost per Effective Exposure for magazines is less than half that of primetime network, and about a fifth that of online advertising. Clearly, by these calculations, magazines remain an extremely efficient vehicle for advertising delivery.
References/Bibliography:
Ball State University (Papper, Holmes, Popovich, & Bloxham); “Middletown Media Studies”; 2005.
Galbi, Douglas A. for Common Carrier Bureau, FCC; “Communications Policy, Media Development, and Convergence”; 2001.
Simmons, W.R. for Life; “A Study of Advertising Memorability Among Readers of Life Magazine and Viewers of Prime Time Television Programs”; 1965.
McPheters & Company for Parade; “Ad Retention: Parade Vs. Television”; 2005. MRI; “Survey of the American Consumer”; 1998-2008
Nielsen Media Research; “A2/M2 Three Screen Report”; July, November 2008
Online Publishers Association; “A Day in the Life: An Ethnographic Study of Media Consumption”; 2006
TVB, Nielsen Media Research Custom Survey; 2008, as reported in “Time Spent & Daily Reach” by Media InfoCenter. Ad Age; “Cable Best at Keeping Audience Through Ad Breaks”; 23 October 2007
i A partial listing includes Arbitron, Forrester, MRI, Nielsen, Pew Research Center, Simmons, and Scarborough.
ii Nielsen A2/M2 Three Screen Report, November 2008.
iii Nielsen A2/M2 Three Screen Report, November 2008, MRI Fall 2008.
iv Nielsen and Online Publisher’s Association.
v McPheters & Company analysis of MRI data from 1998-2008; TVB, Nielsen Media Research Custom Survey 2008.
vi McPheters & Company analysis of MRI data from 1998-2008
vii MRI Fall 2008.
viii While our intent was to focus on display ads, and specifically banner advertising, this conclusion holds when video ads are also included. Search ads were not included in this analysis nor were classified or small space ads in magazines.
ix Nielsen C3 ratings as reported in Ad Age, 23 October 2007